Help Desk, IT Service Management (ITSM) & Customer Service in the Cloud
How does Giva differ from other SaaS helpdesk, customer service and IT service management applications?
- Deploy in days, train in 1 hour
- Robust, fast & painless reporting for higher quality decision-making
- Highly customizable without programming or consultants
Why Choose Giva for Your Help Desk, ITSM, & Customer Service Software Needs?
Established in 1999 and based in Sunnyvale, California, Giva was one of the first to develop a full suite of help desk, IT service management, and customer service software platforms based in the cloud. Today, after hundreds of customer-collaborated software releases, Giva continues to lead the industry with HIPAA-compliant and ITIL-framework solutions.
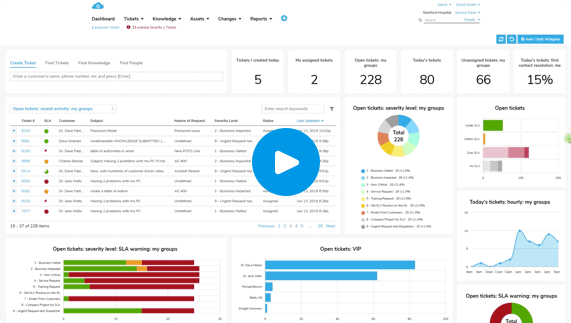
Intuitive Cloud Service Desk Dashboard
Some of the chief concerns we hear from people just like you is your frustration with obtaining constant visibility to critical issues. Sound familiar? Giva's Home Page Dashboard provides constant visibility to hot spots and highlights critical issues with charts, metrics and analytics.
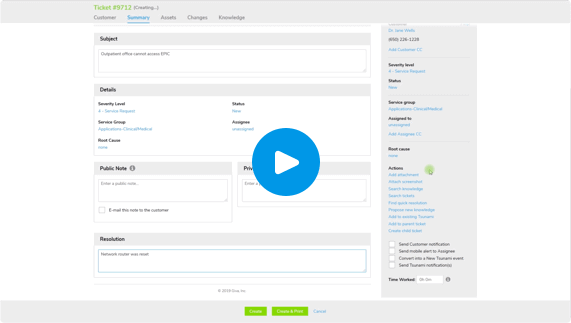
Ticket, Service Request & Incident Creation Made Simple
We have people on our team just like you who have years of experience in the help desk, IT service management and customer service trenches so they know that speed and simplicity really matters. As a result, we have built very clean and intuitive helpdesk ticket management and IT service management (ITSM) screens. Anybody in customer service will also enjoy our fresh and easy-to-use design. In fact, we're known by our customers as the "Apple Computer" of IT and customer service cloud applications. We have a seamlessly integrated knowledge base to help quickly resolve issues and other tools like scheduled tasks, macros, parent/child tickets, Tsunami tickets, quick tickets, and quick resolutions to speed resolution, streamline workflows and increase customer satisfaction.
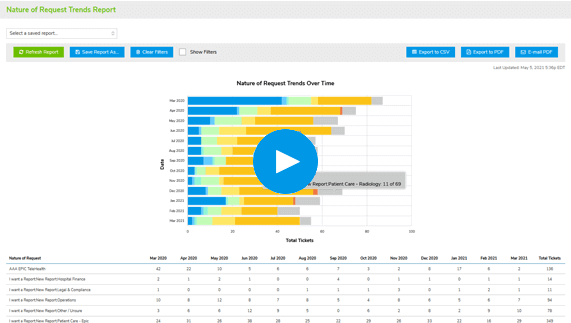
Standard and Easily Customized Reports
Each report features our Giva Easy Three-Click Reporting™ engine that allows you to quickly build standard and completely customizable report queries.
We know that you need to measure the service desk's performance with metrics, charts, and graphs to reward stakeholders and take action when necessary. Giva Reports help you reduce time spent building, customizing, and routinely running Reports. Our visual reporting tools allow you to analyze data, understand relationships and proactively highlight trends and patterns early on.
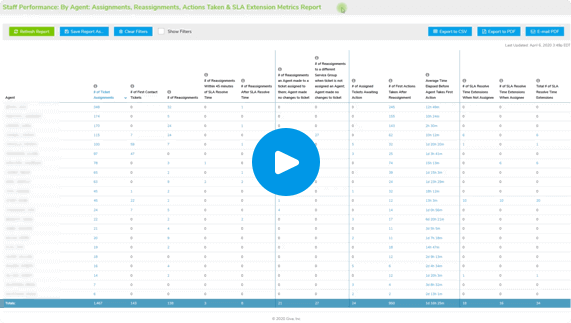
Staff Performance Reports
Giva's Staff Performance Reports provide analytics and deep insights to better lead your organization and manage all the important aspects of employee performance. The Reports offer objective statistics with drill-down capability to measure the performance and capability of Giva agents. Over a reasonable time, these metrics and analytics can objectively measure differences in agent capability, productivity, focus, initiative, diligence, and customer satisfaction.
These reports also make it easy for CIOs or VPs of Customer Service to measure individual and performance in real time and after issues are closed. This encourages the full engagement of Level 1-2-3 resources and eliminates finger pointing and blame.
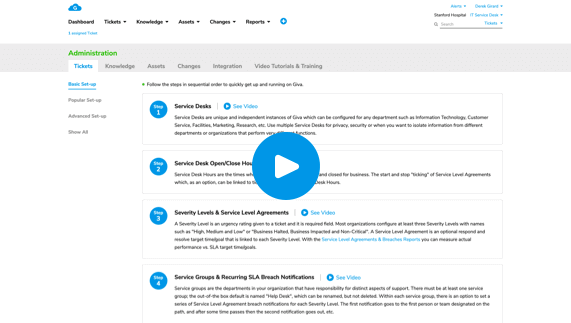
Easy to Customize and Configure to Your Needs
Your help desk, IT service management (ITSM) or customer service system must be flexible and adapt to the way you run your organization. With Giva, you can define business rules and customize the workflow based upon how your organization works. Customization and configuration are all point and click with no programming or consultants needed to deliver a substantially lower total cost of ownership (TCO). An intuitive administration suite with a library of "how to" videos helps you to get up and running quickly and keeps Giva well tuned as your requirements change.
Giva's built for small, medium and large organizations. For example, a ten-person department can be up and running on Giva in just hours, or an organization with a hundred IT or customer service agents can start using Giva in just days.