Change Management KPIs: A Complete Guide for ITIL Teams
Change management KPIs are measurable indicators used to track how well an IT organization plans, executes, and sustains changes to software, systems, and processes. In ITIL® frameworks, where this practice is formally called Change Enablement, these KPIs fall into three categories: human adoption, process execution, and financial impact. Tracking all three is what separates reactive change teams from those that can consistently demonstrate the business value of their change programs.
As IT leaders and professionals know, ITIL is a best-practice framework that guides IT Service Management (ITSM), and it provides the foundation for the change management KPIs that IT teams use to govern, track, and report on every change to their infrastructure and services.
When ITIL version 4 launched in November 2018, Change Management became Change Enablement. Enabling, managing and tracking Change Management in ITSM requires a smooth operational process and one of the most effective ways to ensure this is by monitoring these using key performance indicators (KPIs).
In this article, we will give you more information on the KPIs you can use to measure and monitor changes in ITSM, using ITIL best practice guidelines and frameworks.

What is Change Enablement in ITIL?
Anything change-related in ITIL and ITSM is "the addition, modification, or removal of anything that could have a direct or indirect effect on services."
Change Management (Change Enablement) effectiveness is only as good as how well it is implemented. It's important to ensure that everyone on an IT team, and those who will be affected by software or hardware changes, is aware of the potential impact, such as scheduled or unscheduled downtime.
The goal of ITIL Change Enablement is:
"To maximize the number of successful IT changes by ensuring that risks have been appropriately assessed, authorizing changes to proceed, and managing the Change Schedule."
Hence the need to follow Change Enablement best practice guidelines and, within that framework, adhere to KPIs so that the ITSM team and stakeholders can monitor outputs, performance, and changes being made.
There are three types of changes that can be made by ITSM teams:
- Standard Change: Low-risk, pre-authorized, and easy to understand and implement. A change manager is responsible for overseeing these once a Request for Change (RFC) is submitted.
- Normal Change: Higher-risk, usually larger in scope or impact, and this involves planning and oversight from the Change Advisory Board (CAB).
- Emergency Change: Unexpected changes required following an incident, usually a serious one, and these often involve an emergency Change Advisory Board to approve.
For most changes, an RFC is an essential component of the process, as without this, there's no way of knowing what's being done or monitoring the outputs.
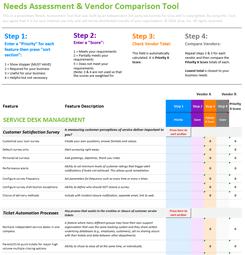
For more information, here is Giva's Free Template: Request For Change (RFC) ITIL Checklist.
Now let's look at the KPIs ITSM teams can use to monitor Change Enablement outputs and performance.
Category 1: Human Adoption KPIs
Technical change metrics tell you whether a system change was implemented cleanly. Human adoption KPIs tell you whether the people affected by the change are actually using it, and using it well. Both dimensions are important, in that, a change that succeeds technically but fails in adoption delivers none of its intended business value:
-
Adoption Rate
Adoption rate measures the percentage of target employees actively and consistently using a new tool, workflow, or process after rollout.
Formula: Adoption Rate (%) = (Number of active users ÷ Total impacted users) × 100
An adoption rate below 70–80% after a defined ramp period typically signals that communication, training, or sponsorship activities need reinforcement before the change can be considered successful.
-
Time-to-Adoption
Time-to-adoption measures the number of days or weeks from initial rollout to the point where a defined adoption threshold (usually 80%) is reached across the target user group. Shorter time-to-adoption shows effective training and active sponsorship. This metric is especially useful for comparing rollout efficiency across multiple change initiatives within the same organization.
-
Training completion rate measures the percentage of employees required to complete enablement sessions who have done so before go-live or within a defined window after rollout.
Formula: Training Completion Rate (%) = (Employees who completed training ÷ Total employees assigned training) × 100
Low completion rates are a leading indicator that adoption rate will also be low making this one of the most actionable early-warning KPIs available to change managers.
-
Employee Sentiment Score
Employee sentiment is typically captured through pulse surveys at defined intervals during and after a change. A common format scores awareness, understanding, buy-in, and perceived support on a 1–5 scale at each wave. Tracking sentiment over time shows whether concerns are being addressed or escalating, giving change managers actionable data before adoption metrics turn negative.
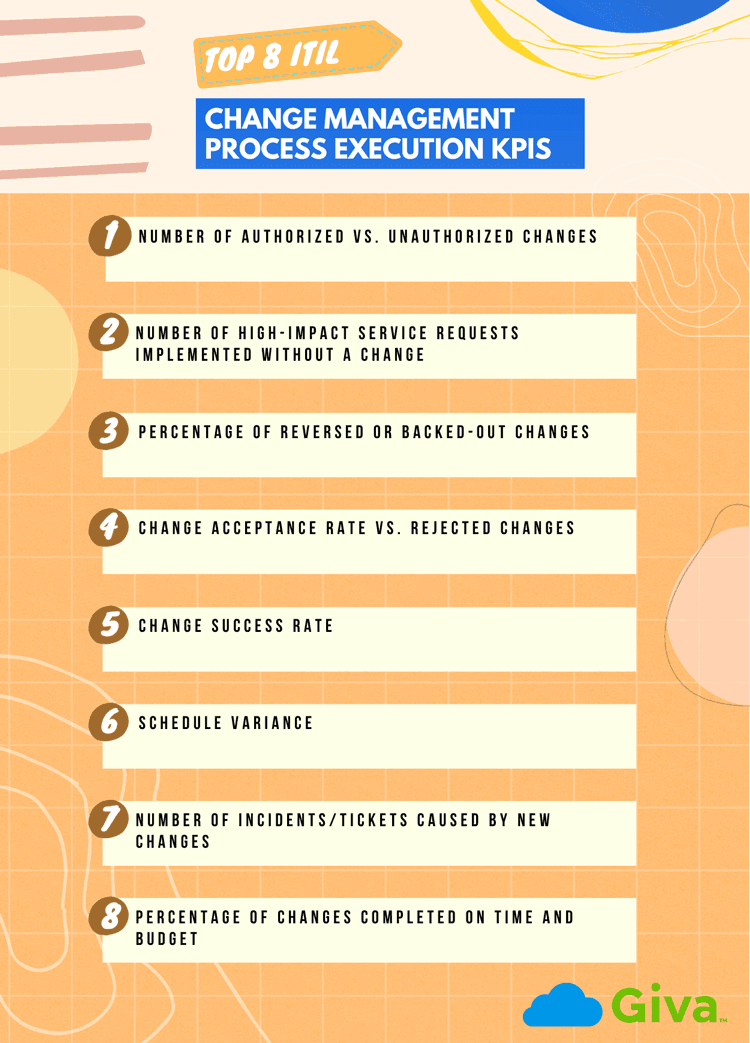
Category 2: ITIL Process Execution KPIs
Process execution KPIs track the operational performance of the change process itself, such as authorization controls, implementation success, rollback rates, and schedule adherence. These are the metrics ITIL has always been strongest on, and they form the backbone of any Change Enablement reporting framework. Where Category 1 metrics tell you how people are responding to a change, these metrics tell you whether the change was delivered as planned:
-
Number of Authorized vs. Unauthorized Changes
The aim is to keep the number of unauthorized changes low compared to authorized changes.
A low number of unauthorized changes over a fixed timescale (e.g., every month, quarter, year), shows that you have a robust and responsive approval process and can handle changes effectively.
-
Number of High-Impact Service Requests Implemented Without a Change
High-impact service requests are another type of change that's been implemented without an RFC.
This can happen for numerous reasons, such as vendor software updates that are rolled out without going through an ITSM team's Change Enablement process.
You can track these changes and monitor their impact using a configuration management database (CMDB). However, a high number over a fixed period suggests that your IT infrastructure is vulnerable, and you need to take a strategic approach to reduce the number of high-impact service requests implemented without a change.
-
Percentage of Reversed or Backed-Out Changes
Every change being implemented needs a back-out or rollback plan. You must be able to restore systems to how they were prior to changes being made in case anything goes wrong during implementation.
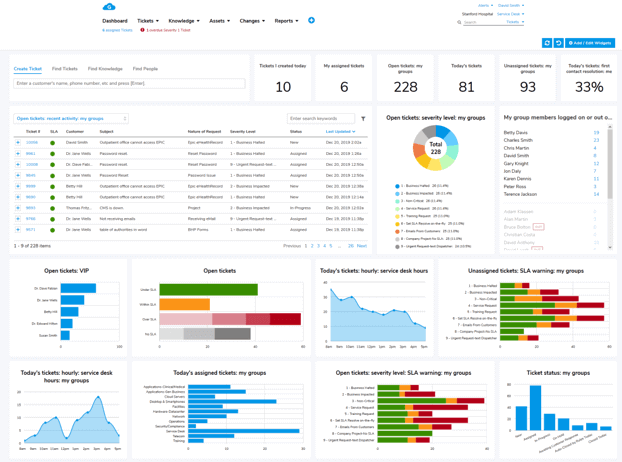
Track this metric with a Change Enablement software suite, such as Giva's SaaS Change Enablement Software, including its intuitive, customizable Change Management metrics dashboard.
A high percentage of reversed or backed-out changes suggests there are too many poorly planned or executed changes going through the RFC process.
-
Change Acceptance Rate vs. Rejected Changes
A high change acceptance rate is a way of monitoring the number of change requests being approved by the CAB.
This KPI shows that your organization's Change Enablement process is robust, operational, and effective.
-
Change Success Rate
Change Success Rate measures the percentage of approved and implemented changes that achieve their intended outcome without causing service disruption or requiring rollback. It is distinct from change acceptance rate (which tracks CAB approval before implementation) and from backed-out changes (which tallies post-implementation failures individually).
Formula: Change Success Rate (%) = (Successful changes ÷ Total implemented changes) × 100
A consistently high change success rate, with industry benchmarks typically target above 95% for standard changes, indicates that risk assessment, testing, and planning processes are working end-to-end.
-
Schedule Variance
Schedule variance is the difference between the amount of time a change implementation is expected to take vs. the amount of time it actually takes.
For example, implementing a fairly standard change request should take two hours. Instead, it takes five in practice, creating a schedule variance of three hours.
It's a useful KPI for assessing whether your change plans are being implemented efficiently. A high cumulative number shows that changes need to be communicated and implemented more efficiently.
-
Number of Incidents/Tickets Caused by New Changes
As IT professionals know, not every change goes to plan. Unfortunately, some changes cause a cascade effect of incidents and support tickets as a result of a change being implemented.
A high number of incidents/tickets as a result of changes shows that they need to be communicated better. Especially if these changes are going to affect other operational and service areas within the wider organization.
-
Percentage of Changes Completed on Time and Budget
And finally, IT leaders and stakeholders need to know how many changes have been completed on time and within budget. Especially if third-party vendors and suppliers are involved.
Even if that is not the case, budget holders need to know: How much did this particular change project cost internally? E.g. how many hours of internal time did it take to implement?
A higher percentage of changes completed on time and within budget shows that you have an effective Change Enablement process in place.
Category 3: Financial KPIs for Change Management
Process metrics tell you how changes are being executed. Financial KPIs tell you whether the investment in change management is delivering measurable business value, and that is the question IT leaders most often face from executives and budget holders:
-
Cost of Change
Cost of change captures the full direct and indirect financial investment required to implement a change: internal labor hours, vendor or consulting fees, software licensing, training delivery, and the cost of any service disruption during rollout. Tracking cost per change request and not just in aggregate makes it possible to identify which categories of change consistently run over budget and to build more accurate planning estimates over time. It also creates the baseline needed to calculate ROI.
-
Change Management ROI
ROI links the financial benefit of a change to its total cost.
The standard formula is: ROI (%) = ((Benefits Realized – Total Change Costs) ÷ Total Change Costs) × 100
For IT changes, benefits typically include reduced incident volume, efficiency gains, decreased unplanned downtime, or labor hours saved. Prosci's Best Practices in Change Management research found that projects with excellent change management are seven times more likely to meet or exceed their objectives than those with poor change management, which makes a compelling case for treating ROI measurement as a core discipline of the change program.
How to measure Change Enablement KPIs in ITIL/ITSM
One of the most effective ways to measure and monitor Change Enablement KPIs in ITIL/ITSM is with Change Management software. Giva's ITIL Change Enablement tool defines processes to speed up approvals and manage the documentation needed to support high-velocity releases.
This way, your processes and systems can be aligned with ITIL's best practices. At the same time, you can even integrate this software with your organization's Configuration Management Database (CMDB).
Ensure RFCs and templates for these are ready to use so that there's a smooth workflow for the entire process.
Change Enablement software allows for complete change visibility, fast implementation, cross-team collaboration, and agile change control.
Putting Your Change Management KPIs Into Practice
Tracking change management KPIs across all three dimensions of human adoption, process execution, and financial impact gives IT leaders a complete picture of whether their change initiatives are actually working, not just whether they were technically delivered. Most ITIL teams start with the process execution metrics because they are the easiest to pull from existing ITSM tooling. The human adoption and financial KPIs take more deliberate effort to capture, but they translate most directly into business language. That's the kind of reporting that wins continued executive investment in the change program.
You do not need to implement all of these KPIs at once. A focused dashboard of three to five well-defined metrics, measured consistently over time, delivers more insight than a sprawling report no one trusts. Pick the KPIs most aligned with your current change goals, establish your baselines, and build from there. The ITIL Change Enablement framework gives you the process structure, and the KPIs give you the evidence that the structure is doing what it should.
How Giva Supports Change Management KPI Tracking
Giva's Change Management Software includes a built-in, customizable Change Management metrics dashboard that makes it straightforward to manage your processes in a single view. The RFC workflow captures the request and approval data that feeds your financial KPIs, reducing the manual aggregation typically required to calculate cost of change and time-to-completion per request.
Explore Giva to see how the dashboard and reporting tools support a consistent KPI tracking practice, or take a look at the Change Volume Report in the interactive product tour.
For more, get a demo to see Giva's solutions in action, or start your own free, 30-day trial today!


Categories: IT, Help Desk