How to Use the Balanced Scorecard Approach to Achieve World-Class Service Desk Performance
The troubled Service Desk manager called the ITIL Guru and asked to see her right away. When he arrived, he had a panicked look on his face. The ITIL Guru calmly asked, "What has got your feathers ruffled?"
The manager said, "I just received an email from the CIO asking about my department's metrics. He says that they don't look great compared to top service desks. Before I respond, I wanted to get your opinion."
"Performance metrics can be very tricky, especially for a Service Desk. Your metrics are influenced by how IT collectively handles escalated incidents, service requests, and customer service. And, most importantly, IT strategy and funding significantly impact the Service Desk. And he did not tell you where he got his metrics?"
"No, he didn't."
"Alright. Let's look at Service Desk performance metrics in greater detail. Perhaps that might give us a clue about what he is referring to. Stay with me as we step thought this to get to the best way to handle these metrics—a balanced scorecard..."
Common Mistakes When Reporting Service Desk Performance
"Here are some of the more common mistakes most Service Desks make when reporting their metrics:
- Publishing only single, standalone performance metrics when they are dependent upon each other. For example:
- Number of contacts handled (dependent on staffing and complexity)
- Call talk time and hold time (dependent on the call type of call, user ability, and agent training)
- ASA: Average Speed to Answer (dependent on staffing)
- Abandoned calls (dependent on staffing)
- Comparing performance to general averages rather than benchmarked data from comparable Service Desks
- Failing to link Service Desk performance to IT strategy (if there is one)
- Not aligning performance to business unit needs (i.e., all business units are not the same)
- Not including the delivery cost (i.e., every call handled has a price, including customer lost productivity while waiting. Escalation significantly increases cost.)
- Mixing customer satisfaction with incident satisfaction
- Not measuring alignment to customer priorities
Does any of this sound familiar?"
"Yes, it does.
- I do publish single metrics, compared to general industry numbers that I find in service industry news.
- What I have not done is to compare my numbers to similar Service Desks.
- I do use our customer satisfaction numbers from post-incident/request surveys. But,
- I don't link to the IT support strategy (not sure what that is) or know how to connect to the business units."
Do you measure a modern-day service desk with last-century metrics?
The ITIL Guru replied, "What I mean by last century metrics are those singular metrics that do not look at the whole picture, industrial metrics, not service metrics. Last century we measured widgets-per-shift, tons produced, sales, profit, ROI.
There is an inherent problem when looking at metrics as singular entities—for example, turnaround time. Turnaround time will go down if you rush and give poor service. But customer satisfaction is an essential metric too.
"If ASA is essential because your SLA goal says a maximum of three rings, you cannot do this effectively if management does not correctly staff the service desk, or when understaffed, burned-out Service Desk agents stay on the phone more than four hours a day.
"As I mentioned, most organizations only use published data of a whole bunch of service desks, most not like your service desk. Benchmarking is the only accurate method to find out what your number should be.
"According to MetricNet, a benchmarking firm:1
Benchmarking is a well-established tool for measuring and managing Service Desk performance. Effective benchmarking enables you to quantify the performance of your Service Desk, compare Service Desks to in your industry, identify performance gaps, and define the actions necessary to close the gaps.
"Benchmarking considers the size, the hours of operation, volume, the industry, the sophistication of your customers, the maturity of your infrastructure, agent satisfaction, agent training, and tools, among other metrics. When the sample is large enough, then the accuracy of the comparison becomes more valid.
"By far, the most accurate comparison is through a third-party personalized benchmark. An overlooked benefit is that you can see what those Service Desks that ranked ahead of you do that you don't do. With this information, it is straightforward to target the things to improve through continuous improvement projects, thus, saving you many months of experimenting. It practically pays for itself.
"An alternative to benchmarking is subscribing to the Service Desk Institute2, which publishes an annual benchmark report. Over 12,000 IT service professionals partake. However, use with caution. Every service desk is different, and this report lumps them all together.
A Balanced Scorecard Approach Is All You Need to Encourage World-Class Performance
"In 1996, Robert S Kaplan and David P Norton coined the term in their seminal book, The Balanced Scorecard, Translating Strategy into Action.3 Based on the premise that 'the traditional financial performance measures worked well for the industrial era, they are out of step with the skills and competencies companies are trying to master today.'4 Meaning that we should look at both operational measures and financial measures.
"In Kaplan/Norton's follow-up book, they specifically address IT as the business-in-a-business model.5 We discussed this in our previous talks; manage IT as a business in support of the company. If you follow that to the conclusion, IT strategy directs how the Service Desk should run as the single point of contact for all of IT in support of business needs and, more specifically, each Service Business Unit (SBU).
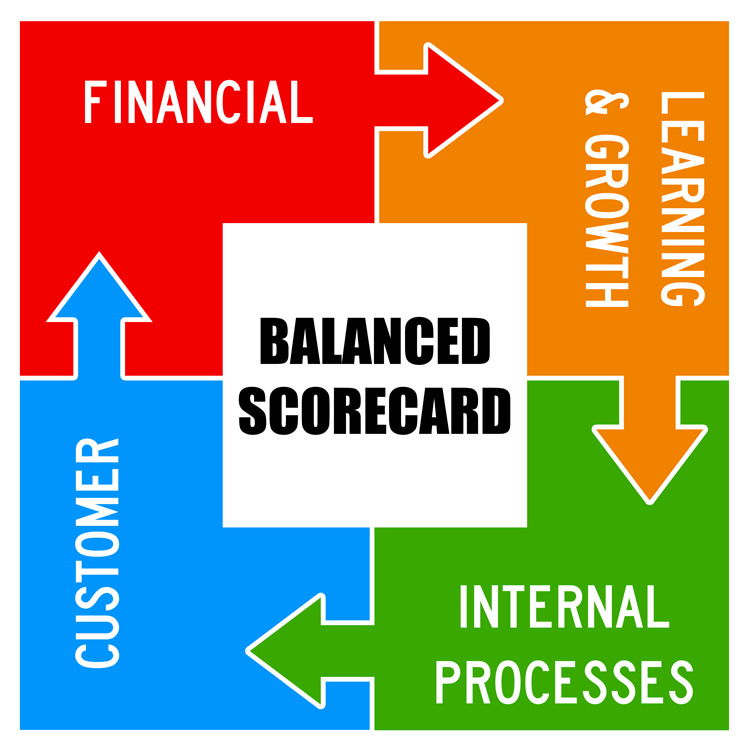
The Balanced Scorecard Links Performance Measurements.6
- How do customers see us? (Customer perspective)
- What must we excel at to make the business successful? (Internal perspective)
- Can we continue to improve and create value? (Innovation and learning perspective)
- How do we look to shareholders? (Financial perspective). When not optimized, business productivity and revenue suffer. IT strategy should view the Service Desk as a value center.
"Is this making sense to you? The balanced scorecard approach says that all metrics are related to one another and, if we want to measure Service Desk performance, we need to look at the entire picture in one snapshot."
"Yes, that is precisely the way it feels running the Service Desk. Now I can see why when I attempt to communicate our performance, those that do not understand Service Desk operations become quickly overwhelmed by all these individual metrics.
"Exactly.
How to Create a Balanced Scorecard to Report Actual Service Desk Performance
Balanced Scorecard Example & Template7
|
Performance Metrics |
Metric Weighting |
Performance Range Worst Case |
Performance Range Best Case |
Your Actual Performance |
Metric Score |
Balanced Score |
|
Cost per Ticket |
25.0% |
$46.23 |
$12.55 |
$37.10 |
27.1% |
6.8% |
|
Customer Satisfaction |
25.0% |
56.2% |
98.4% |
98.4% |
100.0% |
25.0% |
|
First Contact Resolution Rate |
15.0% |
43.8% |
91.7% |
67.2% |
48.9% |
7.3% |
|
Agent Utilization |
15.0% |
25.4% |
63.9% |
25.4% |
0.0% |
0.0% |
|
Agent Job Satisfaction |
10.0% |
57.0% |
89.3% |
78.9% |
67.8% |
6.8% |
|
Average Speed of Answer (ASA) (Seconds) |
10.0% |
327 |
18 |
28 |
96.8% |
9.7% |
|
Total |
100.0% |
N/A |
N/A |
N/A |
N/A |
55.6% |
"You can pick any performance metrics you want, but the six above (column 1) are a good fit for most Service Desks. I should point out the Customer Satisfaction metric comes from randomized customer surveys conducted by an outside professional organization. These are not post-incident surveys.
Now, here is where the benchmarking we discussed earlier comes into play. Columns 3 and 4 are the worst and best from benchmarking data that most correlates with your Service Desk.
The Metric Score = (Worst Case – Actual Performance) / (Worst Case – Best Case) X 100
Finally, your Balanced Score for each comes from Metric Score x Metric Weighting.
In this example, the service desk balanced score is 55.6%. Since the balanced scorecard model is just one of many data points for all comparable Service Desks, 55.6% is in the middle of the bell curve, not the best and not the worst. The beauty of the balanced scorecard framework is you compare yourself on an apples-to-apples basis, not to non-similar Service Desks."
"WOW! The balanced scorecard is fantastic! I feel much better. Thanks for teaching me something I did not know. I look forward to using it in our continuous improvement initiative."
Footnotes:
1. Service Desk Benchmarking Defined, MetricNet, 10/21/2012, p. 1
2. Service Desk Benchmarking Report v.9, Service Desk Institute, May, June 2019
3. The Balanced Scorecard, Kaplan and Norton, Harvard College, 1996
4. The Balanced Scorecard-Measures that Drive Performance, Kaplan, and Norton, HBR Magazine (Jan-Feb), 1992
5. The Strategy-Focused Organization, Kaplan and Norton, Harvard Business School Press, pp. 203-209
6. "The Balanced Scorecard – Measures that Drive Performance," Kaplan and Norton, HBR Magazine, Jan-Feb 1992
7. The Service Desk Balanced Scorecard," MetricNet, Jeff Rumburg, p. 2

Categories: IT, Help Desk