ITIL Service Desk Practice
The Service Desk is at the center of IT & user-IT-user communications. Understand the essential business value & how to optimize you Service Desk Practice.
The concept of an ITIL Service Desk has been around since ITIL® (IT Infrastructure Library) began in the late 1980s. However, shortly after the invention of the telephone were telephone call centers. As computer technology exploded with the first dumb terminals, desktops, laptops, and a proliferation of software and phones-as-computers, businesses realized that not everyone is tech-savvy. And if an employee became stuck with a technology issue, they were less than 100% productive (i.e., lost revenue). Service Desk can quickly pay for themselves if user productivity gains are in the formula.
ITIL is a best-practice methodology for adopting the international IT Service Management (ITSM) standard (ISO 20000). Initially, the Help Desk Institute (HDI) focused solely on the help desk (i.e., the Service Desk). In 2008, ITIL and HDI realized they were on parallel courses. HDI rebranded itself as the Service Desk Institute (SDI) to remove the confusion. Because the Service Desk is at the center of IT and the center of user-IT-user communications, it makes sense to optimize the Service Desk Practice.
Understanding the essential business value of the Service Desk is the purpose of this article.
What is the Purpose of the IT Service Desk?
"The purpose of the Service Desk Practice is to capture demand for incident resolution and service requests. It should also be the entry point and single point of contact for the service provider with all its users."1
A Service Desk should make it easy for users: with one phone number, one email, one portal, one mobile application, or one chat to get the attention of the Service Desk. The Service Desk may also operate a walk-in service. Many Service Desks utilize text and social media messaging, public and corporate social media, and discussion forums. A Service Desk should take in user issues and manage public media information and support for the IT organization. The Service Desk is the voice of IT.
According to MetricNet, while conducting Service Desk benchmarking, when they asked users to choose the word most associated with IT, users chose "Service Desk" 87% of the time. Remarkable. From the user's perspective, the Service Desk is IT!
The Service Desk "provides a clear path for users to report issues, queries, and requests, and have them acknowledged, classified, owned, and actioned."2
Service Desks are not usually technical. However, they can be very technical in some organizations. For this paper, we are talking about a generalist organization, one with broad knowledge of IT services and a practical understanding of the broader business context.
The Benefits of a Service Desk
Most organizations operate a Service Desk because it is an intelligent approach to dealing with first-level IT issues. ITIL lists the benefits that a Service Desk offers business users:3
- Improved customer service, perception, and satisfaction.
- Increased access to communication, information, and services through a Single Point of Contact (SPOC).
- Better customer or user requests, and quicker turnaround.
- Improved teamwork and communication.
- Improved focus and a pro-active strategy for service delivery.
- A reduced negative business impact through quick IT service action.
- Improved IT support and resource usage and increased business user productivity.
- More meaningful management information (e.g., incident and service request data) for decision support.
The Objectives of the Service Desk
Above all, the Service Desk's primary mission is to provide a single point of contact between the service provider and users. As we will discuss later, a Service Desk transaction is less costly than at Level 2 or 3 and provides higher customer satisfaction. The Service Desk manages incidents and service requests and handles all IT communication with users.
The following list of specific responsibilities demonstrates a broad range of Service Desk objectives:4
- Logging all relevant incident/service request details.
- Providing Level 1 investigation and diagnosis.
- Whenever possible, resolving incidents or service requests when first contacted.
- Escalating incidents/service requests that they are unable to resolve within predetermined timeframes.
- Communicating resolution progress with users.
- Auditing incident/service request tickets for accuracy before closing the tickets.
- Conducting customer/user satisfaction call-backs/surveys as agreed with Service Level Management.
- Communication with users, keeping them informed of impending changes or outages.
- Updating the Configuration Management System (CMS).
- Providing Service Desk perspectives to the planning activity of the Service Value Chain (SVC) (i.e., Project Management Practice).
- Providing the early life support SPOC for the Deployment Management Practice.
After reading the listed objectives, it is clear that the Service Desk works closely with other ITIL Practices:
- Incident Management for optimizing incident resolution.
- Request Management for service requests.
- Change Enablement for standard changes.
- IT Asset Management Practice is not about moving IT assets to users. IT Asset Management is for planning and managing the full lifecycle of all IT assets. An asset is defined as something of value. Financial Management defines the value (i.e., >$500). Deployment Management moves IT assets to users.
- Knowledge Management is more than guiding incident resolution and FAQ. They manage information across all of IT.
- Problem Management for using problems and known errors to resolve recurring incidents and or workarounds.
- Security Management for the initial security breach and expedited security response.
- Deployment Management is early life support, specifically transferring goods and services from IT to users.
Service Desk types
Service Desks have many structure options to fit business needs.
Some of the most common:5
-
Local Service Desk:
- One location within the business site.
-
Centralized Service Desk:
- Many business locations with one Service Desk handling all locations.
-
Virtual Service Desk:
- Uses technology to give the impression that the Service Desk location is in the building.
- When a company promotes working-from-home, the Service Desk becomes virtual.
-
Follow-the-sun Service Desk:
- Works well for global businesses with a Service Desk on different continents.
- May assist in supporting different languages, customers, and time zones.
-
Specialized Service Desk:
- A personal Service Desk for top executives, or
- A highly technical Service Desk (e.g., for the emergency room in a health care facility).
No matter which forms you support, they should:
- Use the same ticketing system to consolidate incidents and requests.
- Use the same Service Knowledge Management System (SKMS) to share the best resolution knowledge.
- Use a single language for documentation.
Service Level Management (SLM) Practice and the Service Desk
Service Level Management (SLM) is the ITIL business performance Practice. The metrics SLM gathers from across the organization are a window into Customer Satisfaction (CSAT), business alignment, and costs.
The Service Desk has a critical role in the Service Level Management Practice. As the Single Point of Contact (SPOC) for IT, everything flows through it. The Service Desk sets the users' expectations during the first few minutes of a conversation. Get the expectations wrong, and CSAT goes down. An efficient, customer-focused, and friendly Service Desk makes all the difference in the final CSAT score. If the Service Desk is understaffed, under-trained, and stressed out, CSAT will reflect that regardless of what the rest of IT does. The Service Desk is an extension of all the other IT departments, not an island.
What does the Service Desk need to succeed?
There are many ways to support and help a Service Desk become a strategic asset:
- IT customer service directives shared by all of IT.
- The proper staffing levels.
- Active support for continuous improvement from all the other IT departments.
SLM direction through SLAs
The SLM Practice sets clear business-based service level targets. It ensures adequate assessment of the delivery of IT services and that they can be monitored and managed against these targets.6
SLM provides one Service Level Agreement (SLA) for every service described and in the Service Catalog. The SLA describes the responsibilities of IT and its users. The SLA sets agreed metrics for service delivery, including the Service Desk. The Service Desk must be part of the negotiation.
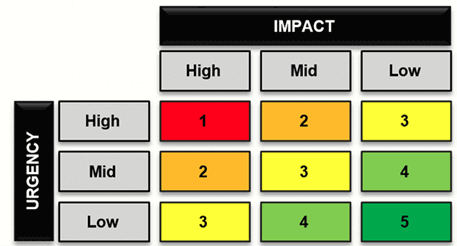
A critical part of the SLA is describing service priorities and response times.
It is up to the Service Desk to set the ticket priority. Business impact and urgency are how the Service Desk determines priority. They do this critical role for every user that contacts the Service Desk.
The second part of setting priorities is assigning response and resolution times. The SLA states these, but most users have never read the SLA. The Service Desk is responsible for setting user expectations. After the Service Desk sets the priority, they explain the reasoning, developing a tacit understanding between the Service Desk and the user. Then, no matter the level of support or service group, everyone must do whatever they can to meet or exceed the expected time.
The SLA sets both business and IT agreements, and the Service Desk, with every user contact, must explain IT's response to this particular situation. Without this formal expectation setting, users will make their own choices and be disappointed when misaligned. With every contact, the value of the Service Desk is necessary to make it happen.
Example of SLA for incident priority
| Low | Medium | High | |
|---|---|---|---|
| Priority Description | |||
| Severity | Hinderences to the work of individual users and an acceptable workaround is available. | Work interruption to individual users and a good workaround isn't available. | Interruption to critical processes affecting individual users and no workaround available. |
| Urgency | Immediate resolution is not needed by the user. | The user does not require immediate resolution. | The user needs prompt resolution. |
| SLA Conditions | |||
| 95% of the tickets must be assigned within: | 8 Hours | 2 Hours | 1 Hours |
| Resolved within: | 1 Week | 2 Days | 24 Hours |
How SLM and OLAs support the Service Desk
The SLAs for each service are just one of many parts of setting expectations. Before SLM sets SLAs, they ensure that all IT departments create Operational Level Agreements (OLA) between each department because an SLA is a total response of many groups.
OLAs ensure all departments can support the SLA requirements.
"An operational level agreement (OLA) is an agreement between an IT service provider and another part of the same organization."7
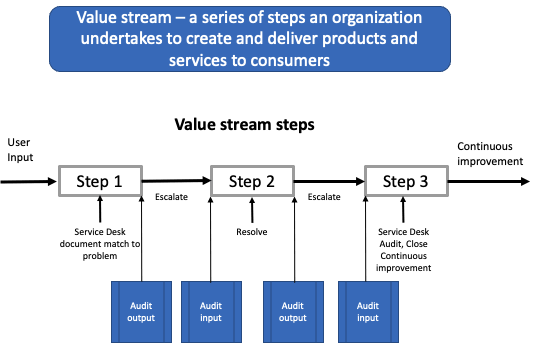
"A value stream is a series of steps an organization undertakes to create and deliver products and services to consumers."8
There is always a danger of setting SLA goals without accurate data to support them. Service teams working together to map out value streams is one way to accomplish two critical tasks simultaneously, (1) mapping all the steps and (2) looking for waste. Much can happen between the Service Desk receiving the call, documenting it into the call tracking system, escalating it to the applications team, and resolving and sending the ticket back to the Service Desk for closure.
In this case, the SLM Manager of the Service Desk and the SLM Manager of the application team work together to create a value stream that works for everyone, including the user. Once satisfied that it is efficient, they document the value stream and make an OLA that both can agree on. The OLA supports the times that end up in the SLA.
When the Service Desk takes a call from a user, they follow the application team's guidance in talking and gathering the correct data to put into the ticket and setting user expectations.
OLAs may have many parts. OLA writing is the time for each member of the value stream (e.g., escalation of an incident/request from the Service Desk to the 2nd or 3rd Level) to put forward what they need to be successful. For example:
-
What questions should the Service Desk ask the user to determine what they are experiencing:
- Perhaps providing a template to follow
- Providing knowledge articles
- Directions on how best to document the incident or request.
- Directions on proper categorization for incidents or requests.
- Examples and tools the Service Desk can use for diagnosis or resolution.
- How long the Service Desk has to resolve, and when should they escalate.
- When the ticket requires improvement feedback, how should this occur?
-
Continuous Service Desk training by 2nd and 3rd Level:
- Knowledge articles
- In-person training of Service Desk agents
- OJT (on-the-job training) for each Service Desk new hire at 2nd and 3rd Level
-
Project Management input requests:
- Service Desk participation in background experiences to planning
- Service Desk role in Deployment Management
-
The roles and responsibilities of each in support of the IT department Shift-Left strategy:
- How can the Service Desk learn to resolve more tickets
- What does the Service Desk need to impact CSAT scores.
An OLA is a living document subject to continuous improvements. Along with Problem Management, all members cooperate to better support users and free up 2nd and 3rd-Level operational demands so that more improvement projects occur.
The goal is to relieve 2nd and 3rd-Level pressure. Besides their technical resolution skills, the primary use of 2nd and 3rd is for improvement projects aligned with business demands. More tickets resolved at the Service Desk means more projects and the elimination of recurring incidents.
Service Desk staffing factors
About three-fourths of Service Desk costs are related to labor, so decisions about how to staff a Service Desk are fundamental to the operation of the business.
Many factors go into right-staffing the Service Desk, and there are too many to discuss in this high-level paper. ITIL lists the following:9
- Customer service expectations.
- Business requirements, such as budget and call response times.
- Level of self-help tools available (i.e., password resets).
- IT infrastructure and Service Catalog's size, relative age, architecture, and complexity.
- The number of customers and users to support.
- Incident, service request, and Request for Change (RFC) types.
- Duration of time required for call types.
- The volume and types of incidents and service requests.
- Hours covered.
- The type of response required (e.g., telephone, email, chat, texting).
- The level of training required.
- The support technologies available (e.g., phone systems, remote support tools).
- ITIL Practices in use.
Setting the correct staffing levels is much more complicated than going online for staffing guidelines. Staffing costs money. So do supporting tools. But what costs the most money is user lost productivity waiting for support from IT (e.g., Service Desk + 2nd Level + 3rd Level).
Suppose IT wants to be a strategic asset of the business. In that case, there should be an appropriate analysis of user lost productivity at the current level to appropriately determine what Service Desk investments to make.
Workforce and Talent Management role in staffing the Service Desk
ITIL Workforce and Talent Management Practice supports the Service Desk as it matures from an isolated, barely supported Practice to one with more responsibility, resolving a more significant number of incidents and requests.
Workforce Management uses techniques developed in the early days of telephone exchanges. Erlang-A formula determines the minimal number of agents for the required service level every 30 minutes of the day. This approach is infinitely more accurate than an internet query about average Service Desk staffing. No two businesses (e.g., infrastructure, reliability, age, complexity, and user computer sophistication) are the same, and their service level demands are just as varied.
Workforce scheduling software tools use many weighted calculation variables. It all goes into complicated formulas starting with agent scheduling to managing Customer Experience (CX) and Employee Experience (EX).
Data quality begins with the Service Desk
Besides the importance of answering the phone and setting user expectations, the Service Desk is accountable for accurate ticket data. This documentation must be 100% accurate for two reasons:
- Level 2 and Level 3 staff must have accurate ticket documentation to save time trying to figure out what the Service Desk meant to say.
- Problem Management requires every incident to be linked to a problem making it infinitely easier to determine the root cause and thus saving time and increasing user productivity.
Incident matching is critical for Problem Management
Two Service Desk requirements support accurate documentation:
- Every incident and request must have the highest service category field that matches a service in the Service Catalog. The category helps service management directives.
- Problem Management can only be effective with accurate incident documentation. None of the tools work with insufficient data.
The Service Desk is responsible for incident matching as part of the incident logging procedure. Many incidents recur regularly, with the appropriate resolution actions well known. Without incident matching, Problem Management can't do its job effectively.10
Incident audits are a valuable tool for Service Desk document excellence
The accuracy of incidents and requests is crucial for continuous improvement. With support from all IT departments (i.e., OLA), it is easy to devise an effective audit of incidents and requests to ensure data excellence. Using a value stream, you can insert audits throughout the stream to ensure that when the Service Desk closes the ticket, it is 100% accurate. A best practice is auditing before the next step, and the next agent audits to ensure correct input.
The economics of a Shift-Left support strategy
A Shift-Left strategy starts at the highest IT levels. At its simplest, it is to do whatever it takes to resolve incidents and service requests at the Service Desk and reduce escalations. Why would you want to do that? Because the cost per ticket to resolve at the Service Desk is $172 per ticket less than Level 3, and customer satisfaction is many times higher at the Service Desk. Isn't this what we all want? Happy, productive users at the lowest cost?11 Shift Left by Jeff Rumburg.
| Support Level | Name | Cost to Resolve Ticket | Total Cost Including Service Desk/Ticket | Percent Increase/Decrease |
|---|---|---|---|---|
| 1 | Service Desk | $22 | $22 | 0% |
| 2 | Desktop Support | $69 | $69 + $22 = $91 | 314% |
| 3 | IT Support | $104 | $104 + $22 = $126 | 573% |
| Field | Travel to site | $221 | $221 + $22 = $243 | |
| Vendor | Vendor Support | $599 | $599 + $22 = $621 | |
| 0 | Self Help | $2 | -$20 | -91% |
| -1 | Problem Management | 0$ | -$22 | -100% |
| -2 | Search & Destroy (AI) |
The cost per ticket resolution is additive when escalated
MetricNet is a benchmarking company that focuses on the Service Desk. The above diagram numbers are for North America. What does it tell us?
- It costs $22 to solve a ticket at the Service Desk (i.e., Level 1)
- It costs $69 at Level 2 plus the cost of the ticket generation at the Service Desk ($91).
- It costs $104 at Level 3 plus the cost of the ticket generation at the Service Desk ($126).
Shouldn't this get our attention? The cost of Service Desk resolution is a good deal! Why is it lower at the Service Desk? It is lower because the ticket does not need escalation. The time to resolve is less at the Service Desk. Less time equals increased user productivity and increased user satisfaction. Both of these are precisely what IT should want.
How does Shift Left benefit IT?
The next question is, what do Level 2 and 3 do with the time saved from not having to resolve as many escalated tickets?
- Spend more resources on continuous improvement projects.
- In order to stop incidents from happening, speed up Problem Management.
- Create knowledge articles to support the Service Desk in resolving more tickets.
- Invest time in training Service Desk staff.
- Provide ongoing feedback on escalated tickets to reinforce the Service Desk skills to resolve more tickets.
- Create self-help technologies for users. (Self-help: $2/ticket).
- Help set higher quality acceptance in Service Design. The root cause of all incidents is poor design.
Service Desk metrics - only two metrics matter!
There are all sorts of metrics for a Service Desk. However, using a balanced metric approach, there are just two metrics that matter:
Cost Per Ticket and Customer Satisfaction!12
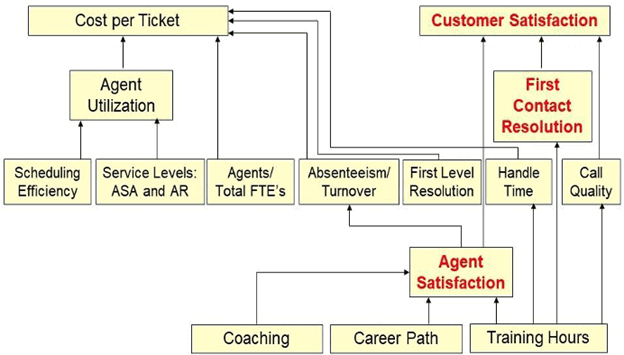
Looking at this balanced metric diagram, it is easy to see why it is necessary to look at the whole Service Desk picture because there are many dependencies. Add to this 2nd and 3rd-Level training and supporting tools, and it is well within reach for an inefficient Service Desk to become an excellent Service Desk with just the proper staffing provided.
Bottom line: 4 Service Desk takeaways
This Service Desk should be treated like the strategic asset that it is. In most cases, IT departments do not need more employees. They should use what they have more efficiently:
-
The Service Desk is the face of IT:
- Support it to be the face you want IT to be with the proper staffing, tools, and training to do all the tasks that users expect.
- Embrace the Shift-Left strategy to increase First Contact Resolution (FCR).
-
Set Big Hairy Audacious Goals (BHAGs) for all IT departments:
- Reduce recurring incidents by 10% per month through Problem Management. Get out of firefighting!
- Increase standard changes to 80% of total changes.
- Increase the number of successful project management changes supporting continuous improvement and better business alignment.
- Increase the number of ITIL Practices to fulfill the concept of excellent service management.
Footnotes:
- ITIL® Foundation, ITIL 4 Edition, AXELOS Global Best Practices, 2018, p.149
- Ibid, p. 149
- ITIL Service Operation, 2011 (ITIL 3) Edition, Axelos Global Best Practices, p. 157
- Ibid, ITIL 3, p. 158
- Ibid, ITIL 3, p. 159-161
- Ibid, ITIL 4, p. 152
- Ibid, ITIL 3, p. 333
- Ibid, ITIL 4, p. 32
- Ibid, ITIL 3, p. 162-163
- Ibid, ITIL 3, p. 80-81
- Metrics That Matter - Shift Left, Jeff Rumburg, 8/25/2020
- Ibid., Metrics that Matter, Jeff Rumburg

About the Author
Bart Barthold
Bart Barthold is an independent senior ITIL instructor with years of experience in combining ITIL knowledge with practical expertise in running a world-class support organization. He has earned the certificate for the highest level of ITIL training - IT Service Manager, holds an MBA, and he has taught various ITIL certifications and hundreds of students since 2004.
Bart is known for his outstanding performance in IT service management and is a recipient of the Help Desk Institute's prestigious Team Excellence Award in 1998. He also finished second in 1997, making him one of the most decorated IT service managers in the industry.