Customer Satisfaction Metrics: Top Measurements Plus How-To's
 By Ron Avignone
Customer satisfaction is a direct representation of the effectiveness and overall health of your business. Satisfied customers are more likely to remain loyal. And inevitably, the more satisfied loyal customers you have, the more revenue your business will generate.
Customer satisfaction metrics are the measurements businesses use to quantify how well their products, services, and support experiences meet customer expectations. Tracking specific ones is the best way to gauge how happy your customers are with your product or service. Customer satisfaction data can help you execute customer satisfaction initiatives and offer an exceptional customer experience.
Moreover, tracking customer satisfaction metrics gives companies quantifiable insight into customer loyalty, experience quality, and long-term profitability. These metrics help identify friction points, reduce churn, and guide continuous improvement efforts across sales, support, and product development.
The business case for tracking these metrics is well-documented. According to Forrester, customer-obsessed organizations achieve 41% faster revenue growth, 49% faster profit growth, and 51% better customer retention than industry peers. Tracking the right customer satisfaction metrics gives organizations the early warning they need to act before dissatisfaction compounds.
In this article, we'll discuss ten essential customer satisfaction metrics, including why they are essential and details on how to calculate them. Let's jump in.

10 Customer Satisfaction Metrics to Track for Better Business Results
Type "customer satisfaction metrics" into a search engine and you'll be flooded with long lists of metrics. Some of the results may not be helpful for your business.
So, before measuring metrics, a good first step is determining which are unnecessary and which are key satisfaction metrics for your specific use case.
To help you brainstorm, we selected ten customer satisfaction metrics you can track to offer a better customer experience.
- Net Promoter Score
- Advanced Net Promoter Score
- Customer Satisfaction Score
- Customer Effort Score
- Customer Health Score
- Customer Churn Rate
- Customer Lifetime Value
- Average Speed to Answer
- Average Abandonment Rate
- Customer Service Satisfaction
-
Net Promoter Score (NPS)
NPS measures your customers' loyalty to your brand and their willingness to recommend you to their peers.
A typical question that measures the NPS sounds like this: "Given your overall experience with our products and services, how likely are you to recommend us to others?"
How to Calculate
Those who are willing to recommend your product or service are "promoters." And those who are not willing are "detractors." A third group represents "passive" customers who are not willing to recommend you, but also won't discourage others either.
To calculate your NPS, subtract the percentage of detracting customers from the percentage of promoting customers. A simple NPS formula is as follows:
NPS = % of Promoters - % of Detractors
Typical Benchmarks
- A positive NPS indicates more promoters than detractors.
- Most industries average between +20 and +40, while +50 or higher is considered excellent.
- Top-performing companies often achieve +70 or more.
-
Advanced Net Promoter Score (NPS+)
Finding your NPS helps you know how many of your customers are likely to recommend your brand. However, it does not provide you with the why behind your score. That's where the NPS+ metric comes in handy.
While not considered an "official" CSAT metric (as NPS is), NPS+ gives the benefit of uncovering why your promoters are happy and why your company's detractors are unhappy.
How to Calculate
After your customers provide an NPS score, they can provide more detail by responding to an open-ended question. For example: "Why did you give us this rating?"
This is valuable because you can uncover the reason behind your NPS score. You can use the written responses to help facilitate data-driven decisions and corrective plans.
Typical Benchmarks
- Because NPS+ adds qualitative feedback, aim for similar numeric NPS levels (30–50+) while monitoring the proportion of comments that express positive sentiment.
- Ideally, 70% or more of written feedback should be favorable.
-
Customer Satisfaction Score (CSAT)
The Customer Satisfaction Score (CSAT) tells you if your customers are satisfied. The higher the CSAT score, the more satisfied your customers are with your company.
How to Calculate
CSAT scores are calculated with a survey scale question. Typically, the scale is either 1-10, 1-7, or 1-5. CSAT is calculated by dividing the number of happy customers by the total number of responses and then multiplying by 100.
CSAT Score = (# of Satisfied / Total # of Responses) x 100
Another way to measure this metric is to find the total percentage of happy customers. To see that, you divide the number of happy customers by the total number of customers, then multiply by 100.
% of Happy Customers = (# of Happy Customers / Total # of Customers) x 100
Typical Benchmarks
- Across most industries, a CSAT of 75–85% is considered strong.
- Scores above 90% indicate an exceptional level of customer satisfaction and consistent service quality.
-
Customer Effort Score (CES)
CES helps you determine how easy your product or service is to use. In other words, the CES metric is used to measure how much effort is required from your customers. Ideally, you want to decrease the effort your customers are required to exert. Making your product or service easy to use is a great way to boost brand loyalty.
How to Calculate
CES scores are measured on a spectrum from "Very Easy" to "Very Difficult".
- Very Easy
- Easy
- Neither
- Difficult
- Very Difficult
You can gauge your CES by asking a survey question like: "How easy was it to use our service (or product) today?
There are two common ways to calculate CES, depending on how your survey is structured:
-
Text-Based Scale (Net CES Method)
If your survey uses text options (e.g., Very Easy → Very Difficult), you can calculate CES by subtracting the percentage of "Difficult" responses from the percentage of "Easy" responses.
CES = % Easy - % Difficult
A higher CES indicates customers find your product or service easier to use.
-
Numeric Scale (Average CES Method)
If your survey uses a numeric scale (for example, 1 = Very Easy and 7 = Very Difficult), calculate CES by dividing the sum of all ratings by the total number of responses.
CES = (Sum of Effort Ratings / Total # of Responses)
In this version, a lower CES score is better, since it means less effort is required from customers.
Both formulas measure the same concept — perceived effort — but offer different ways to interpret your data. Choose the method that aligns best with your survey format and reporting preferences.
Typical Benchmarks
- For text-based scales, aim for 70% or more "Easy" or "Very Easy" responses.
- On a 1–7 numeric scale, an average score between 1.5 and 2.5 (closer to "Very Easy") represents a healthy experience.
-
Customer Health Score (CHS)
Customer health is a measurement of whether or not your customers will remain loyal or churn over time. The CHS metric is unique because it helps identify customer behaviors over time.
How to Calculate
You can determine the CHS score by examining variables such as:
- Product usage period: The longer the usage period, the healthier the score.
- Number of interactions with the support team: Typically, fewer interactions are better.
- Money spent with your brand: More money spent indicates satisfaction.
- Willingness to answer surveys: Voluntary survey responses are a good indication of loyalty.
Each of these factors can be assigned a weighted value based on its importance to your business. The combined total forms the Customer Health Score.
CHS = (Weight1 × Product Usage) + (Weight2 × Support Interaction Score) + (Weight3 × Spending Level) + (Weight4 × Engagement Level)
The specific weights depend on what matters most to your organization, for instance, a SaaS company might emphasize usage frequency, while a retail business might prioritize spending.
For example, if product usage is weighted at 40% (0.4), spending at 30% (0.3), engagement at 20% (0.2), and support interactions at 10% (0.1), you could combine those weighted values to generate an overall CHS score on a scale of 0–100% (or 0-1.0).
The end goal of CHS scores is to organize your customers into categories. CHS score categories could include "weak," "healthy," and "at risk." Tracking these categories over time helps you predict churn and focus retention efforts where they're most needed.
Typical Benchmarks
- Healthy customer segments usually fall between 70–100 on a 0–100 scale.
- A CHS below 50 often signals risk of churn and should trigger proactive engagement or outreach.
-
Customer Churn Rate (CCR)
Your CCR identifies how many customers you have lost over a period of time. This is an important metric to track because it can help you identify customer behavior patterns that lead to churn. Controlling your Customer Churn Rate is vital because it's more expensive to acquire new customers than it is to retain existing ones.
How to Calculate
Calculating your CCR is relatively straightforward. First, you must identify your calculation time period, for example, annually. Then, subtract the number of customers at the end of the year from the number at the start of the year to get the total number of churned customers. Then, divide the result by the total number of customers at the start of the period.
CCR = (# of Customers Lost / Total # of Customers) x 100
Typical Benchmarks
- Acceptable churn varies by industry, but most businesses target a monthly churn rate under 5% or an annual churn rate below 20%.
- Subscription and SaaS companies often strive for less than 3% monthly churn.
-
Customer Lifetime Value (CLV)
CLV is a measurement of the total profit from a specific customer to a business over the entire business relationship. CLV is one of the most vital metrics for understanding customer satisfaction, retention, and loyalty.
Instead of looking at individual transactions, the CLV measures all transactions a certain customer has (or will make) during their customer lifespan. There are two ways to measure CLV– historic customer value and predictive customer value.
- Historic CLV: How much an existing customer has already spent
- Predictive CLV: An estimate of how much they might spend in the future
To calculate the predicted CLV, predictive analytics are required to forecast future trends.
How to Calculate
The Historic CLV metric is calculated by first finding the customer's value. A customer's value is determined by multiplying their average purchase cost by the average frequency of their purchases.
Then, you multiply the customer's value by your company's average customer lifespan. To find the average customer lifespan, divide the average number of years a customer remains loyal by the total number of customers.
CLV = (Average Purchase Cost x Average Frequency of Purchases [ie. Customer Value]) x (Company's Average Customer Lifespan)
Typical Benchmarks
- While CLV varies widely, a healthy benchmark is maintaining a CLV-to-Customer Acquisition Cost (CAC) ratio of 3:1 or higher, meaning each customer generates at least three times what it cost to acquire them.
-
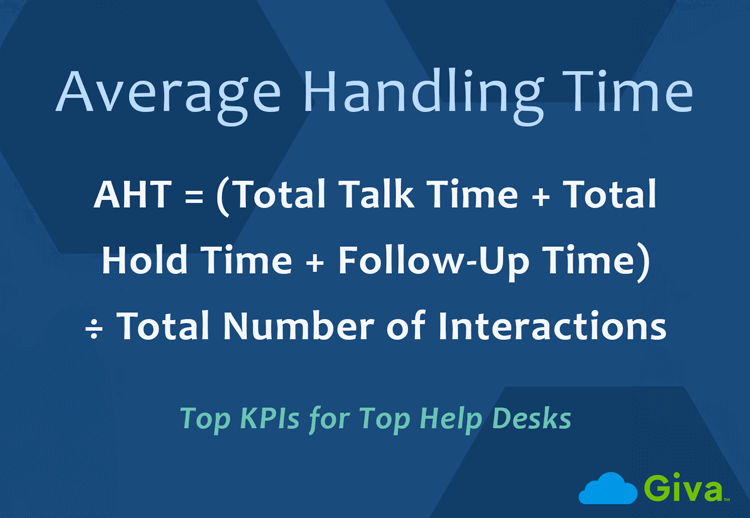
Average Speed to Answer (ASA)
The ASA metric identifies how long customers wait for customer support personnel to answer the call. ASA also measures the time after the initial greetings are finished. ASA metrics improve or accelerate when the contact center is well-staffed and the personnel are well-trained.
To be clear, ASA isn't only for phone calls. This metric includes answer times of emails and chat rooms.
How to Calculate
The ASA score is calculated by dividing the total wait time by the total number of answered calls, emails, or chats.
ASA = Total Wait Time for Answered Interactions / Total # of Answered Interactions
But what counts as "wait time" depends on the channel:
Channel
Definition of Wait Time
Phone Calls
Time from when the call enters the queue until an agent answers.
Live Chat
Time from when the customer submits a chat request until the agent joins the chat.
Email/Tickets
Time from when the email or ticket is received until the first agent reply is sent.
You can calculate ASA separately for each channel (recommended) or combine them for an overall average if you want an overall "speed-to-respond" metric.
Typical Benchmarks
- Contact centers generally aim for an ASA under 30 seconds for calls, under 45 seconds for live chats, and under 1 hour for email or ticket responses.
-
Average Abandonment Rate (AAR)
Your AAR metric shows the number of abandoned calls or sessions in a specific period of time. Abandoned calls are those that end before a customer can speak with a customer service agent. The goal is to have the lowest possible AAR.
Measuring your AAR is essential because it's an indication of your contact center's performance. A high AAR may be an indication that your call routing strategies are ineffective. It can also serve as a precursor metric for overall customer satisfaction because CSAT and AAR scores are typically intertwined.
How to Calculate
To calculate your AAR, divide the number of abandoned calls (or sessions) by the total number of incoming calls (or sessions) and multiply by 100 to get a percentage.
AAR= (# of Abandoned Calls / Total # of Incoming Calls) x 100
Typical Benchmarks
- A good AAR target is under 5% for well-managed contact centers.
- Rates above 8–10% often signal long queue times or staffing inefficiencies that affect customer satisfaction.
-
Customer Service Satisfaction (CSS)
CSS measures how satisfied customers are specifically with a support interaction itself, such as the agent's knowledge, responsiveness, and ability to resolve the issue, as distinct from overall product or brand satisfaction. Where CSAT captures experience-level sentiment, CSS focuses on the interaction: Did the agent help effectively, and was the issue resolved?
Tracking CSS separately lets managers surface training opportunities and recognize high-performing agents, even when broader CSAT fluctuates due to product issues outside the team's control.
How to Calculate
CSS surveys are sent immediately after a support interaction and ask customers to rate the experience on a 1–5 or 1–10 scale with a question such as: "How satisfied were you with the support you received today?" The score is calculated the same way as CSAT:
CSS Score = (# of Satisfied Responses / Total # of Responses) × 100
"Satisfied" is typically defined as a rating of 4 or 5 on a 1–5 scale, or 7–10 on a 1–10 scale. You can also calculate CSS per agent or per team to enable direct performance comparisons.
Typical Benchmarks
- A CSS of 80–90% is considered strong for most support teams.
- Scores above 90% indicate consistently excellent support interactions.
- A CSS below 70% signals issues with agent training, knowledge, or resolution rates that warrant immediate attention.
How to Improve Customer Satisfaction Metrics
Tracking your metrics is only the first step. The next step is turning that insight into action. Improving customer satisfaction metrics means identifying what drives low scores and taking deliberate steps to enhance the customer experience.
Here are several strategies to help boost your satisfaction scores across every major metric:
-
Streamline Customer Interactions
Simplify your customer's journey by removing unnecessary steps or handoffs. A straightforward process improves the Customer Effort Score (CES) and strengthens overall satisfaction.
-
Reduce Wait Times and Response Delays
Long response times are a key factor in low CSAT and high Abandonment Rates (AAR). Use staffing adjustments, routing automation, and proactive notifications to shorten Average Speed to Answer (ASA) times and keep customers engaged.
-
Train and Empower Support Teams
Well-trained, knowledgeable agents improve first-contact resolution rates and positively impact NPS and CSAT. Give your team autonomy to solve issues quickly and provide personalized service.
-
Act on Feedback Immediately
Use your NPS+ and CSAT feedback to identify trends in customer sentiment. Follow up with dissatisfied customers promptly and apply their insights to prevent recurring issues.
-
Monitor and Reward Customer Loyalty
Keep a close eye on your Customer Health Score (CHS) and Customer Lifetime Value (CLV). Recognize long-term customers with exclusive offers or personalized appreciation to encourage repeat business and positive referrals.
-
Use Predictive Analytics to Prevent Churn
Analyze patterns in Customer Churn Rate (CCR) data to detect early signs of risk. Proactively reach out to disengaged customers before they decide to leave.
-
Leverage Automation and AI
Automated tools can track sentiment trends, identify friction points, and alert your team to emerging issues in real time. This helps you make data-driven adjustments that steadily raise satisfaction levels.
-
Monitor Social Media and Online Reviews
Monitor unsolicited feedback channels like Google Reviews, Yelp, G2, and social media, where customers share experiences without being prompted by a survey. Positive mentions reveal what your team is doing well, while negative ones can flag friction points before they appear in your CSAT or churn numbers.
How Technology Can Help Better Your CSAT Metrics
As you can probably tell from the metrics mentioned in this article, there's a lot of data to keep track of. As noted in the last point of the how-to's above, to generate, analyze, and store customer service data, the best companies use powerful customer service technology.
The most effective tools for customer service departments and contact centers now harness the power of AI. Giva offers an AI-powered & HIPAA-compliant customer service software product that can help your service department soar.
-
Giva's Software is Streamlined and Intuitive
The simple design reduces training times and can boost agent productivity by 40%. Plus, the integrated AI-powered Copilots take care of automated tasks, allowing agents to focus on more complex tasks.
-
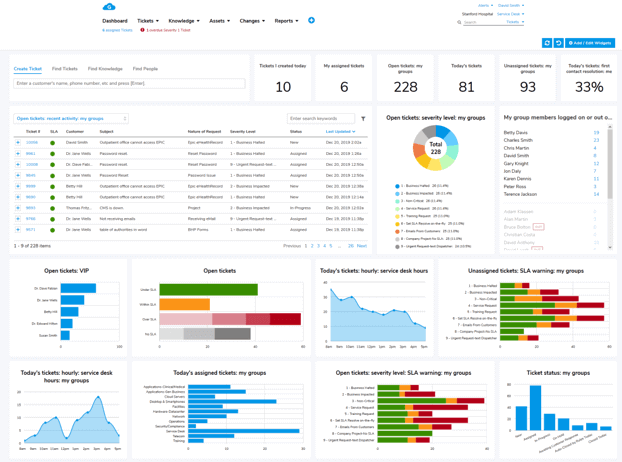
Giva's Software Constantly Measures Performance
Highly visual graphs and dashboards help you study emerging trends in real time. Plus, Giva's robust reporting feature facilitates data-driven decision-making actions. All of this can help improve customer satisfaction scores by 45%.
-
Giva's Software is Safe and Secure
HIPAA Compliance is included in all editions of the product, at no additional cost. Furthermore, the customer service software is covered by a cyber liability insurance policy. This means you can safeguard customer information and remain protected from cyberattacks, data breaches, and malware.
Better CSAT Metrics = Better Business
We threw a lot of formulas at you with this article. But the one formula to rule them all is: better customer satisfaction metrics = better business.
By understanding which metrics are essential to your business model and deploying the necessary software tools to collect data, you can execute business practices that improve overall customer satisfaction.
Ready to learn more about how Giva can help you? Get a demo to see Giva's solutions in action, or start your own free, 30-day trial today!

Categories: Help Desk, Customer Service