Customer Service Reporting: How to Use Metrics to Measure Customer Experience
Learning about how your customers perceive your business and their experience with your products or services can be a big mystery. In addition, understanding the strengths and weaknesses of your customer service department can be convoluted. That is unless you implement routine customer service reporting.
Customer service reports are powerful for two reasons:
- They are the most intuitive way to learn about customer experience.
- They can inform about how customer service personnel are performing.
With insights like that, you can take actionable steps to improve your business and customer experience.
Keep reading to learn more about customer service reporting. In particular, we'll discuss how to implement customer service reporting, including which metrics to pay attention to and best practices. Then, we'll share some success stories and next steps for getting started yourself.

What is Customer Service Reporting Used For?
A customer service report is a tool that presents specific metrics about your business's customer service. The best customer service reports are loaded with information and highly visual graphics to help you interpret and digest the data.
Therefore, customer service reporting is the act of collecting customer service data and analyzing the data to highlight insights that can lead to actionable steps related to your customers' experience.
Generally speaking, customer service reporting is used for assessing the quality of your business's customer service. More specifically, customer service reports are great for:
- Helping agents improve their performance
- Tracking customer service tickets
- Identifying the most common channels customers use to contact your business
- Discovering areas for improvement
- Identifying gaps in your help center's processes
7 Most Important Metrics to Track
Customer service reporting can only be helpful if you're paying attention to the correct customer service metrics. Ideally, the metrics you focus on are directly correlated to the customer service goals you've outlined for your business.
-
Quantity of Customer Service Tickets
The quantity or volume of customer service tickets reflects how many customers are having issues and how busy your service personnel are. Paying attention to volume can highlight a lot of really helpful information. These can include:
- The number of requests received per day, week, or month
- The number of tickets per user
- The most common channels the customers are utilizing
-
Number of Interactions Per Ticket
Interactions per service ticket reflect how efficiently customer service is able to resolve a customer's issue. Typically, when interacting with customers, the fewer the interactions, the more efficient, and the happier the customer. When service tickets require a lot of interaction, customers may get fed up, negatively affecting their experience.
-
Customer Wait Time
Customer wait time refers to the total amount of time a customer waits for the initial response from a service agent. Traditionally, customer wait times were directly correlated to the amount of time they waited on hold on the phone. However, many businesses have moved away from traditional single-channel call centers and toward omnichannel contact centers. Customer wait times now include interactions via email and live messaging in addition to phone calls.
-
Time to Resolution
The overall time to resolution is a measurement of the total time it takes to resolve a customer's issue, from the moment they open a service ticket with the service department to when their ticket is subsequently closed.
A shorter time to resolution reflects not only the speed of your business's customer service but also the quality of the service. Shorter times result in more positive interactions with customers.
-
First Contact Resolution
First Contact Resolution (FCR) is when a customer's issue is resolved the very first time they interact with your customer service department. This includes all potential types of interaction, from self-service help desks to interacting with an agent over the phone.
The more often customers can resolve their issues the first time, the higher your business's first contact resolution rate will be. Higher FCRs generally correlate with effective customer service personnel and satisfied customers.
-
Customer Churn Rate
Customer churn, also known as customer turnover or attrition, is the loss of customers or clients. Therefore, a churn rate is a measurement of the number of customers who stop using your services proportionate to loyal customers.
Your business's churn rate can be analyzed to reveal weak points in your product or services. In addition, churn rates can also highlight the shortcomings of your customer service department.
-
Customer Satisfaction Scores
Customer Satisfaction Scores (CSAT) reflect how well your business's services and/or products meet your customers' expectations. CSAT scores are typically collected directly from customer feedback via surveys. Therefore, CSAT scores can be one of the most important customer service metrics to focus on.
We listed this overall metric last because, generally speaking, it's a representation of how well a customer service department is performing in all the other critical metrics. For example, the higher the FCR and the shorter overall time to resolution, the lower the churn rate and the higher the customer satisfaction.
Best Practices for Customer Service Reporting
Now that we've discussed important metrics of custom service, it's time to provide more detail on how to go about measuring those metrics. We'll discuss items to look for in reporting software, how to get started, and provide real-life examples.
But first, we have six recommended best practices for customer service reporting.
-
Set SMART Goals
SMART goals are Specific, Measurable, Achievable, Relevant, and Time-bound. Customer service reporting is directly correlated to measuring specific and relevant metrics. By ensuring that your end goals are SMART, you can work backward from there to define reporting metrics and key performance indicators (KPIs) that will help you achieve the goals within your pre-determined time.
-
Define a Reporting Schedule
Customer service reporting is not a one-and-done situation. Instead, it's important to continually collect and analyze customer service reports as part of ongoing business. How often your business pulls reports and analyzes the findings will depend on your specific situation.
For example, some start-ups might need to schedule reporting on a monthly basis to better understand how their customer service department is performing. On the other hand, well-established businesses with consistent business and a loyal customer base may choose to schedule reporting every quarter.
-
Drill Down to Metrics That Measure Progress Toward Your KPIs
Above, we discussed seven customer service metrics. In reality, there are many more you could potentially pay attention to. However, whether you're starting with the seven we mentioned or examining the countless other metrics, the fact remains the same. Some metrics are better at measuring progress toward Key Performance Indicators than others.
To do so, it can be helpful to ask yourself two important questions:
- "Which metric(s) directly correlates to my pre-defined KPIs?"
- "Are there other data points that do a better job of measuring my progress toward accomplishing my pre-determined goal?"
-
Simplify Your Reports
There is such a thing as too much data. That's why, as we mentioned above, you don't need to highlight every possible customer service metric. It's the same for your reports. When putting together your customer service reports, it's important to focus on what matters the most.
-
Harness Visuals for Analysis
Pardon the cliche, but a picture is worth a thousand words, right? We agree– especially when it comes to customer service reports.
Gone are the days of lecture-style speeches and wordy PowerPoint slides when discussing customer service data. Nowadays, it's so much more productive to display rich data using visuals like bar and pie charts, scatterplots, and time series charts.
- Bar charts are particularly helpful for comparing one variable against another
- Pie charts are fantastic at showing data across multiple variables
- Scatterplots are effective for highlighting correlations between two data points
- Time series charts are ideal for tracking patterns over time
-
Use Powerful and Purpose-Built Software
You're not in this alone. In fact, it's quite the opposite. There is a myriad of strikingly powerful software on the market that can help you better understand your customer service department and, in turn, provide better service to your customers.
Purpose-built customer service reporting software, like Giva's, can equip your customer service personnel with an AI copilot for automated tasks, dictate innovative workflow, and rapidly garner actionable customer insights.
Speaking of software, let's get into some of the details.
What to Look for in Customer Service Reporting Software
Giva's customer service software is not the only software on the market. But it is one of the best. Regardless of whether you start a trial with Giva or something similar, we feel pretty strongly about what characteristics customer service reporting software should have. The following is a list of qualities to look for, all of which you can benefit from with a Giva product.
- Artificial intelligence: Your highly-skilled IT personnel are the drivers behind Giva's customer service software, but an AI copilot supports them to help boost operational efficiency. For example, the AI copilot can identify the best answer among a voluminous display of data, take care of repetitive actions, and carry out automated workflows.
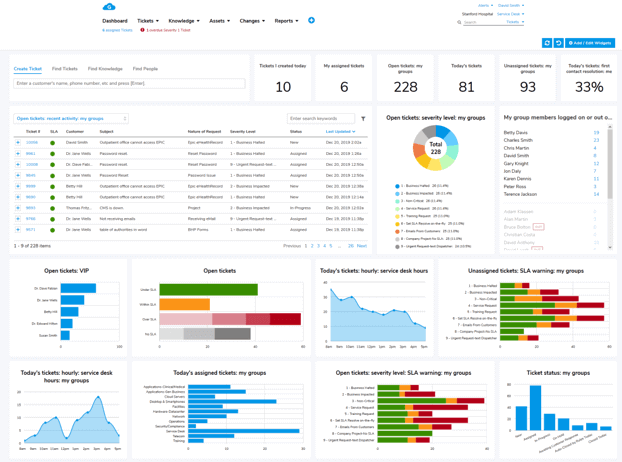
- Visual dashboard, reports, charts, and graphs: Giva's easy Three-Click Reporting™ empowers you to rapidly generate insightful and actionable reports. The reports can be displayed with highly visual dashboards, charts, and graphs, all of which allow you to track key metrics and highlight patterns.
- Set up assistance: We're sure your IT team is beyond brilliant, but that doesn't mean they might not need help getting set up with a Giva customer service product. At no cost to you, Giva's well-trained and USA-based product experts will answer questions and make configuration recommendations during the 30-day trial.
- Cyber security and compliance: All applications and editions have HIPAA/HITECH Compliance at no additional cost and are covered by a Cyber Liability Insurance Policy. Even if your organization is not in a regulated industry, you will still receive the benefits of Giva's advanced cyber security.
- Integrations: Securely integrate LDAP and other applications with Giva's technology. For example, a telecommunication application could generate a link from a phone system that starts the process of creating a service ticket within Giva's cloud applications.
Real-World Examples of Customer Service Reports
-
Customer Satisfaction (CSAT) Score Report
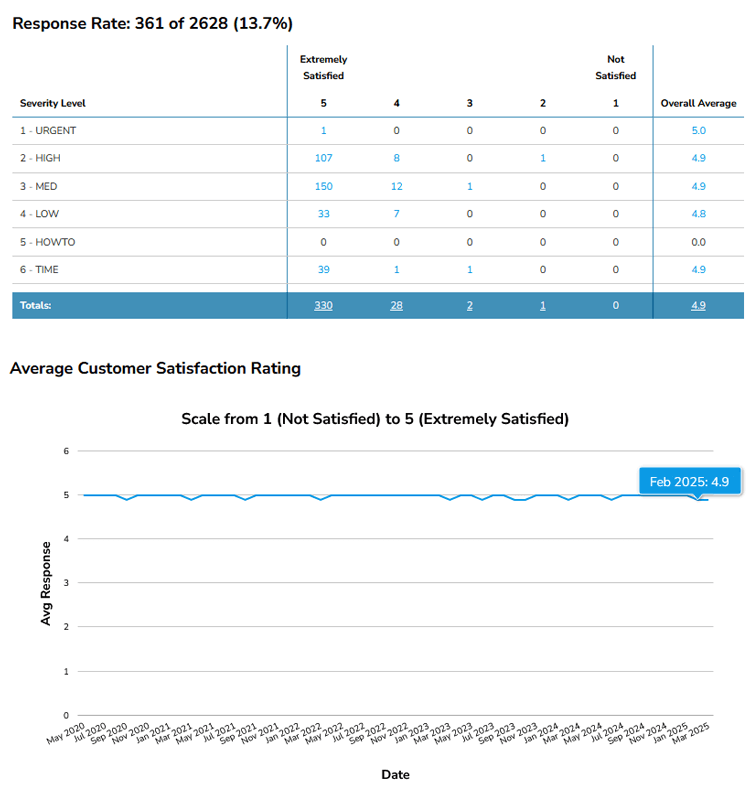
Customer satisfaction, or CSAT, is a measurement of how satisfied your customers are with your product or service. A CSAT score report is a documented summary of how satisfied customers are. CSAT score reports are compiled using survey methodology.
For example, a SaaS company tracks how satisfied customers are after each support interaction with their customer service department. Giva's CSAT score report can quantify the percentage of customers rating their experience positively (e.g., 4 or 5 stars). The CSAT report can even go one step further to help decipher which customer service channel creates the most satisfied customers (e.g., email, self-help, AI chatbot, telephone).
-
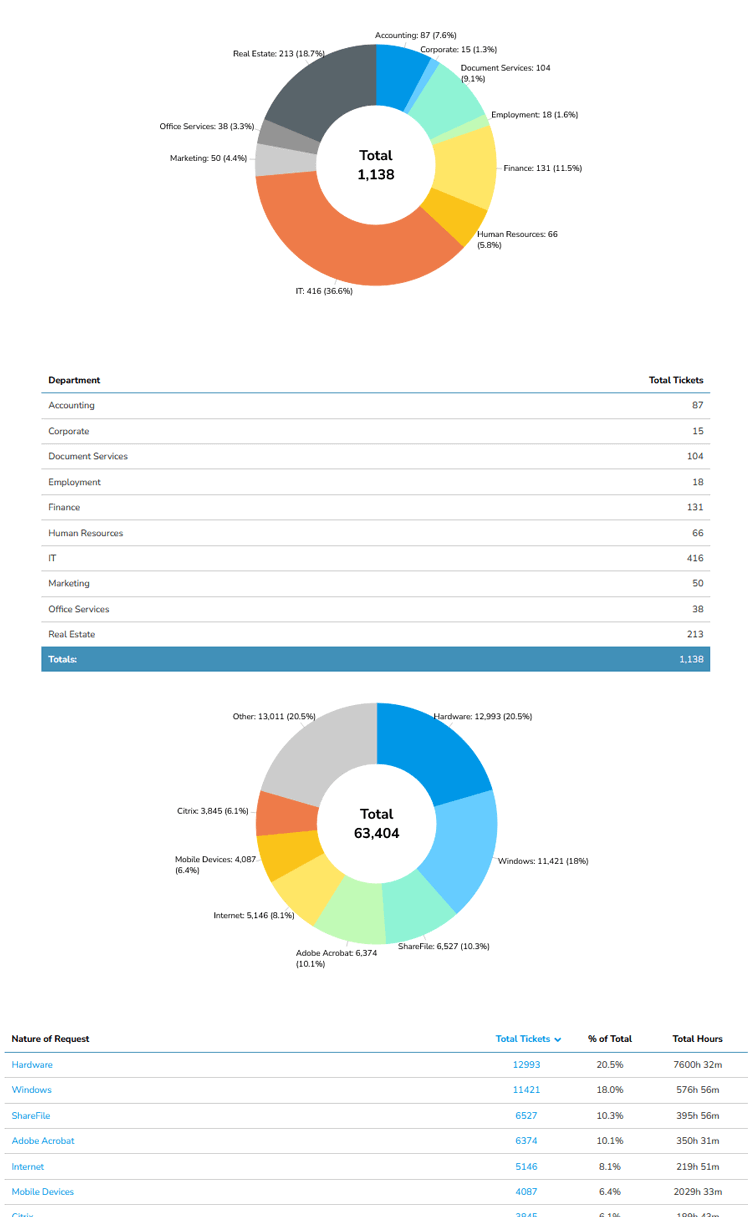
Ticket Volume Report
Customer service ticket volume represents the total number of support tickets received within a given time frame. Tracking ticket volume can help measure performance, allocate resources, and measure trends.
For example, a telecom provider analyzes the most common customer problems. Giva's ticket volume report can help categorically decipher where customers are having the most problems. If the ticket volume reports are broken down by category, like billing, device setup, or outages, the telecom provider can make nuanced decisions about where to allocate more resources.
-
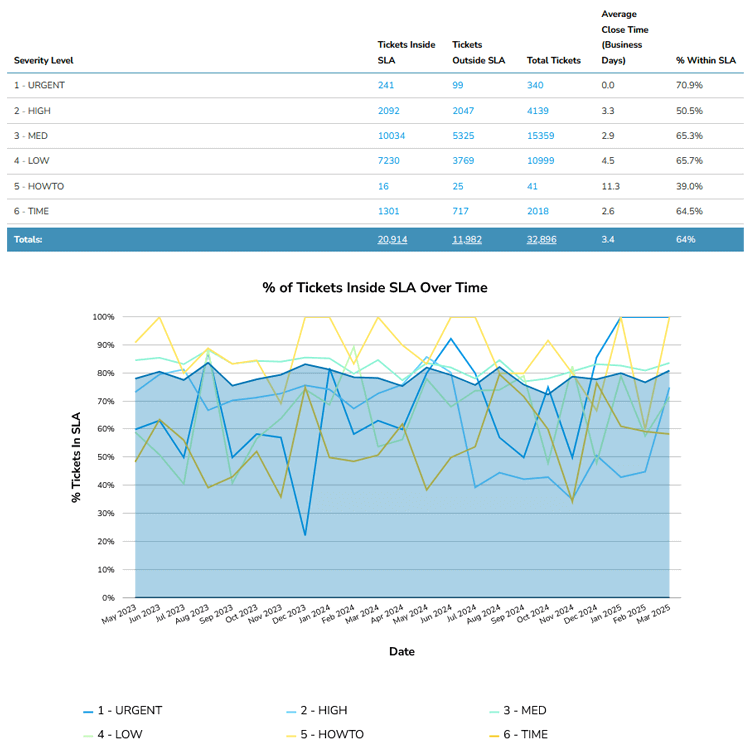
SLA Compliance Report
Service Level Agreements, or SLAs, are contracts between an end-user and a service provider. The SLA specifies contract details, maintenance, delivery times, and other features related to what the customer (end-user) will receive as part of the commitment with the service provider.
Therefore, an SLA compliance report is an analysis of how well (or not) the service provider is executing the SLA. The provider's success is defined by whether or not they are meeting the KPIs outlined in the SLA.
For example, a B2B cloud software vendor wants to ensure support commitments to customers are met as defined by their SLA. Giva's SLA compliance report can show the percentage of tickets responded to and resolved within SLA timeframes.
Getting Started with Customer Service Reporting
Feel like your business is missing the mark? You may just be missing insightful data easily gathered from customer service reports.
- Set or review your customer service goals: Evaluating your customer service goals can be a good first step in reassessing your customer service. Are your goals clearly defined SMART goals?
- Measure customer service metrics toward accomplishing those goals: You don't have to track every metric under the sun. Which metrics will lead you toward the most insightful understanding of your customer service?
- Identify the gaps or pain points in your services: To understand how to improve in the future, it's important to highlight where your services fall short. Where are the pain points in your services, and how are they holding you back or impacting your customers?
- Select a reporting software to address your pain points: You're not in this alone. What modern software tools can you invest in and harness to enhance performance and improve customer experience?
- Circle back and continue the process: You're never done improving, even after revamping your customer service reporting. Now that you know more about your business and customers, what new goals can you set to continue growing?
- Generate Reports Fast and; Reduce High Call Volume: Robust, fast and easy to use reporting reduces high call volume and increases customer and employee satisfaction.
- Data Analytics Customized Reports in 3 Easy Clicks™: Become a data driven decision making enterprise with easy, customized reports in "3 Easy Clicks." You don't need a PhD to use Giva's customized reporting.
- Team Efficiency, Improvement and Productivity Reports: Provide managers with measures of productivity so they can improve team efficiency and monitor all aspects of employee performance.
Improve Your Customer Experience with Powerful Customer Service Reporting
Your customers deserve the best possible experience. Implementing routine customer service reporting is the most effective way to learn about your business and subsequently provide them with that experience.
So, what are you waiting for? It's time to examine closely the details, track your metrics, and analyze your KPIs. The best possible customer service is just a few clicks away!
Giva Offers the Best in Customer Service Reporting
Discover how fast, robust, customizable Reporting Analytics can be the go-to business intelligence tool, bringing a real-time 360-degree customer view, leading to data-driven decision making.
Ready to learn more? Get a free demo to see Giva's solutions in action, or start your own free, 30-day trial today!


Categories: Customer Service