Net Promoter Score (NPS): What It Is, How to Calculate It, and How to Improve It
 By Ron Avignone
Customer loyalty is one of the most valuable things a business can have, and one of the hardest to measure. Satisfaction surveys capture how people felt after one interaction. Repeat purchase data tells you what they did, not why.
Net Promoter Score (NPS) takes a different approach. It asks customers a single question about whether they would recommend you to someone they know, and treats the answer as a proxy for the kind of loyalty that actually drives business growth.
This guide covers everything you need to know about NPS, from how it is calculated and what a good score looks like, to how to run surveys, act on the results, and understand where the metric has limits. Whether you are setting up NPS for the first time or trying to get more out of a program that is already running, here is what the score can and cannot tell you.
What Is Net Promoter Score?
Net Promoter Score is a customer loyalty metric that measures how likely customers are to recommend a company, product, or service to a friend or colleague. Respondents answer on a scale of 0 to 10, and their responses are grouped into three categories:
- Promoters
- Passives
- Detractors
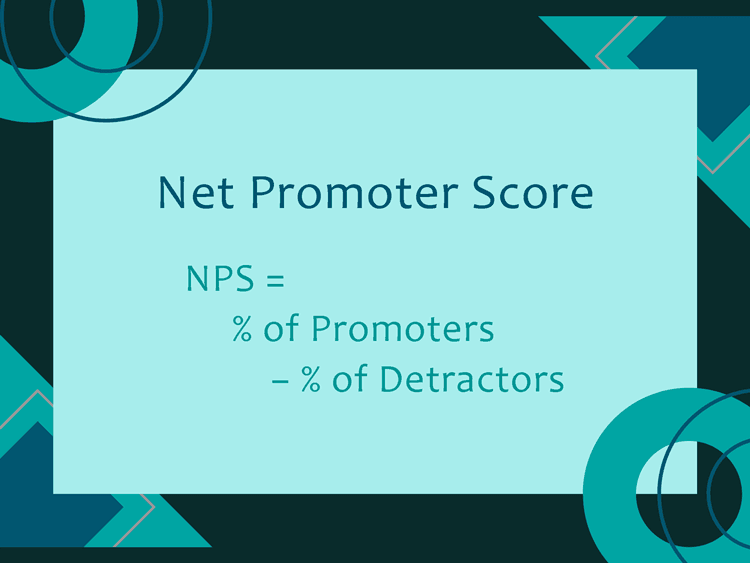
The final score, which runs from -100 to +100, is calculated by subtracting the percentage of Detractors from the percentage of Promoters.
NPS is widely used as a Voice of the Customer (VoC) metric because it gives customers a direct channel to express how they feel about a company's products and overall experience.
Fred Reichheld, a partner at Bain & Company, introduced the concept in a 2003 Harvard Business Review article titled "The One Number You Need to Grow." Reichheld argued that the likelihood to recommend was a better predictor of business growth than traditional satisfaction surveys, because recommending a company to someone you know is a higher-stakes action than simply saying you are satisfied. Satmetrix co-developed the methodology. By 2020, roughly two-thirds of Fortune 1000 companies had adopted some version of NPS.
Bain & Company also developed the Net Promoter System®, which is the broader management framework built around the score. Where NPS is the metric, the Net Promoter System is the operating model. It describes how organizations structure their listening programs, close the loop with customers, and tie feedback to operational decisions. The score is the input, and the system is what organizations do with it.
How to Calculate Net Promoter Score
The standard NPS question is: "On a scale of 0 to 10, how likely are you to recommend [Company] to a friend or colleague?" Companies often include one follow-up open-ended question asking why the respondent gave that score. The follow-up is where the actionable detail lives.
Promoters, Passives, and Detractors
Every NPS response falls into one of three groups based on the score given:
- Promoters (scores 9-10) are loyal customers who actively advocate for the brand. Sometimes called brand ambassadors or brand evangelists, they refer new customers, tend to make repeat purchases, and are less price-sensitive than other segments.
- Passives (scores 7-8) are satisfied but not enthusiastic. They are unlikely to spread negative word-of-mouth, but they are also unlikely to recommend. They are the most susceptible to switching when a competitor offers something better.
- Detractors (scores 0-6) are unhappy customers who may actively warn others away. Any score of 6 or below is a Detractor, including a 5, which might feel like a neutral rating but is not.
That last point catches many teams off guard. The NPS scale is not symmetric. Scoring 5 out of 10 feels neutral, but it places a customer firmly in the Detractor category.
The NPS Formula
The formula is straightforward:
NPS = % of Promoters - % of Detractors
Passives are tracked and reported but excluded from the calculation. Reichheld found that neutral customers have a near-zero effect on referral behavior and revenue growth, and including them would dilute the signal that Promoters and Detractors provide. The resulting score ranges from -100 (every respondent is a Detractor) to +100 (every respondent is a Promoter).
An NPS Working Example
Say 200 customers respond to your NPS survey. 90 give scores of 9 or 10 (Promoters), 70 give scores of 7 or 8 (Passives), and 40 give scores of 0 through 6 (Detractors). The calculation is:
- Promoters: 90 / 200 = 45%
- Detractors: 40 / 200 = 20%
- NPS: 45 - 20 = 25
A score of 25 is a solid result in most industries. What the number does not tell you is why 40 customers were unhappy. That is what the follow-up question is for.
A few common mistakes are worth noting here. Averaging individual scores (treating NPS like a 1-10 satisfaction scale) produces a completely different number and is not NPS. Similarly, combining relational and transactional surveys into one overall score is a category error, since the two measure different things, which the next section explains.
What Is a Good Net Promoter Score?
The Bain Benchmarking Scale
Bain & Company, who developed NPS, offers a general framework for interpreting scores across industries:
- Above 0: Good, meaning you have more Promoters than Detractors
- Above 20: Favorable
- Above 50: Excellent
- Above 80: World-class
These thresholds are useful orientation points, but they are not precise standards. Industry context matters more than the universal scale, which the next section explains.
2025 Industry NPS Benchmarks
Retently's 2025 NPS benchmark report tracks scores across industries using a methodology that requires at least 10 clients per industry and a minimum of 10,000 surveys. Some representative scores:
- Insurance (B2B): 80
- Financial Services (B2B): 75
- Technology and Services: 66
- Healthcare: 53
- Property Management: 52
- B2B Software and SaaS: 41
- Logistics and Transportation: 40
- Cloud and Hosting: 37
- Construction: 34
- Internet Software and Services: 16
B2C companies outperform B2B by approximately 11 percentage points on average. At the other end, airlines and cable providers regularly sit below 20.
Why Industry Context Matters More Than the Universal Scale
A score of 40 is exceptional in software but mediocre in financial services. The most meaningful comparison is against your direct competitors, not against a universal average. If your NPS is 35 and every competitor in your market sits between 10 and 25, you are in a strong position regardless of where 35 falls on the Bain scale.
Regional benchmarks also vary. North American customers tend to score conservatively relative to customers in Latin America or South Asia, where higher ratings are more culturally common. Any cross-regional NPS comparison should account for this.
Relational NPS vs. Transactional NPS
Not all NPS surveys measure the same thing. The way you deploy the survey changes what the score actually represents:
-
Relational NPS (rNPS)
Relational NPS is sent on a fixed schedule, typically quarterly or annually, to measure a customer's overall loyalty to the brand. It is not tied to a specific interaction. The goal is to track the health of the relationship over time and benchmark against past performance or competitors.
rNPS is a strategic metric. CX leadership uses it to set direction, identify whether broad initiatives are working, and understand how the company compares to the market.
-
Transactional NPS (tNPS)
Transactional NPS is triggered immediately after a specific customer interaction, such as a support call, a purchase, or an onboarding session. It captures how the customer felt about that particular touchpoint while the experience is still fresh.
tNPS is a tactical metric. A low score after a support call or contact center interaction reflects on that team and that interaction. It tells you what broke, where, and when, in a way that a periodic relationship survey cannot.
Relational vs. Transactional NPS at a Glance
Feature |
Relational NPS (rNPS) |
Transactional NPS (tNPS) |
Timing |
Periodic (quarterly or annually) |
Immediately after an interaction |
Focus |
Overall brand loyalty |
Specific touchpoint or interaction |
Objective |
Long-term trend tracking and benchmarking |
Immediate, actionable issue detection |
Owned By |
CX strategy / leadership |
Team or department level |
Best For |
Strategic decisions, brand health |
Improving specific processes or teams |
Never combine rNPS and tNPS scores into a single overall number. They measure fundamentally different things, and mixing them produces misleading data. Each transactional survey covering a different touchpoint should have its own separate score.
NPS in B2B: The Multiple Stakeholder Challenge
In business-to-business contexts, NPS requires extra care because a single account typically includes multiple contacts with very different relationships to your product. An executive sponsor, a day-to-day user, and a procurement contact may all have distinct experiences and may respond very differently to the same survey.
Most B2B teams address this by surveying multiple stakeholders per account and tracking scores at the account level alongside individual scores. Weighting by role or influence is common, since the stakeholder who controls the renewal budget often matters more for account risk than a power user who loves the product.
The absence of a response is also a signal. A contact who consistently ignores NPS surveys is frequently a passive or detractor who has disengaged.
Why Net Promoter Score Matters for Business
-
The Connection to Revenue Growth
Bain & Company's research found that differences in Net Promoter Scores among direct competitors explain anywhere from 10% to 70% of the variation in subsequent revenue growth rates, depending on the industry. NPS leaders (the companies with the highest relative score in their market) grow, on average, more than twice as fast as their competitors. These figures come from the Net Promoter System research site published by Bain.
However, NPS does not cause growth directly. What it reflects is the underlying customer experience, and a strong customer experience tends to generate the referrals, repeat purchases, and lower churn that compound into growth over time. NPS captures that signal more efficiently than most other single metrics.
-
Word-of-Mouth and Customer Acquisition
Promoters are the most cost-effective source of new customers a company has. They refer friends and colleagues without any incentive program or marketing spend, and referred customers tend to have higher retention rates than those acquired through paid channels.
Detractors work in the opposite direction. A single unhappy customer who tells their network about a bad experience can cancel out the positive word-of-mouth from several Promoters. NPS gives you a read on the balance between these two forces at any given point in time.
Promoters also tend to have significantly higher Customer Lifetime Value (CLV) than Detractors. They make repeat purchases more consistently, are less likely to switch to a competitor on price, and generate referral revenue at no additional acquisition cost. That combination of retention and referral is a meaningful financial advantage, not just a satisfaction data point.
-
NPS as an Early Warning System
One of the most practical applications of NPS is its value as a leading indicator. Customer churn typically shows up in revenue data weeks or months after the relationship began deteriorating. A falling NPS, particularly among specific customer segments, signals that deterioration early, when there is still time to intervene.
A service desk team that notices a drop in NPS among enterprise accounts after a product update, for example, can investigate and respond before those accounts start evaluating alternatives. The score is not the answer, but it tells you where to look.
How to Improve Your Net Promoter Score: 6 Steps
Improving NPS is not about finding ways to get higher numbers from a survey. It is about addressing the underlying customer experience issues the survey is pointing to. Here is a practical sequence for acting on NPS data:
-
Step 1: Close the Loop with Detractors
Closing the loop means reaching out directly to Detractors to understand their experience and, where possible, make it right.
The timing matters. Research from CustomerGauge found that businesses who closed the loop after an NPS survey had three times the number of Promoters in their next survey compared to those that did not follow up. A response within 24 to 48 hours gives you the best possibility of recovery.
Further, the follow-up should be routed to the right owner. For example:
- A complaint about a billing issue goes to finance or account management
- Whereas a complaint about a product bug goes to product or engineering
A generic "We're sorry to hear that" response from the wrong person signals that no one actually read the feedback.
-
Step 2: Engage Promoters
Promoters are an under-used asset:
- A quick thank-you message tells them their feedback was read
- An invitation to participate in a case study or referral program gives their enthusiasm somewhere to go
Promoter feedback is also valuable internally, telling teams specifically what they are doing well, not just what is broken.
-
Step 3: Focus on Passives
Passives are easy to overlook because they are not creating problems. They are also a churn risk. A satisfied but disengaged customer who hears about a competitor's new feature or a better price will switch more readily than a Promoter who feels a genuine connection to the brand.
Targeted outreach to Passives, such as asking what would make their experience better, often reveals fixable friction points that no one had thought to report.
Small improvements here can move meaningful numbers of customers from the middle group into Promoters.
-
Step 4: Act on Themes, Not Individual Scores
The score alone does not tell you what to fix, but the open-ended follow-up question does. Reviewing responses at scale (grouping them by theme, product area, or customer segment) reveals the issues that actually drive dissatisfaction across the customer base.
For instance, a service desk that sees dozens of Detractor responses mentioning "hard to find the right contact" has identified a process gap that a single response to one angry customer would never reveal. That kind of theme-level insight is what converts NPS from a reporting exercise into a genuine improvement tool.
AI-powered text analytics tools have made this analysis significantly faster. Rather than manually coding hundreds of open-ended responses, teams can use Natural Language Processing (NLP) to automatically categorize themes, detect sentiment, and identify the most common patterns across large volumes of feedback. For high-response-rate programs, this removes a bottleneck that used to delay the "act on themes" step by days or weeks.
-
Step 5: Reduce Response Time and Friction
In service-oriented environments, speed and ease of interaction are the two most consistent drivers of NPS movement. Customers who wait too long for a response, or who have to contact support multiple times to resolve the same issue, reliably score low. First Contact Resolution (FCR) and Average Handle Time (AHT) track these drivers at the operational level and correlate directly with NPS outcomes.
-
Step 6: Make NPS Cross-Functional
NPS is often owned by a customer experience or support team, but the factors that drive it are spread across the organization. Each function owns a different piece of what customers actually experience:
- Product quality
- Billing clarity
- Onboarding experience
- Support responsiveness
The companies that move NPS consistently share results across teams and hold cross-functional reviews. When marketing understands what Detractors are complaining about and product sees which friction points appear most in Passive feedback, the organization can address root causes rather than symptoms.
Net Promoter Score vs. CSAT and Customer Effort Score
NPS is one of three widely used customer experience metrics. The others are Customer Satisfaction Score (CSAT) and Customer Effort Score (CES). Each measures something different, and understanding the distinction helps you use them together effectively:
- Net Promoter Score (NPS) measures long-term customer loyalty and the likelihood of recommendation. It reflects the overall relationship and not a single interaction. It is surveyed periodically.
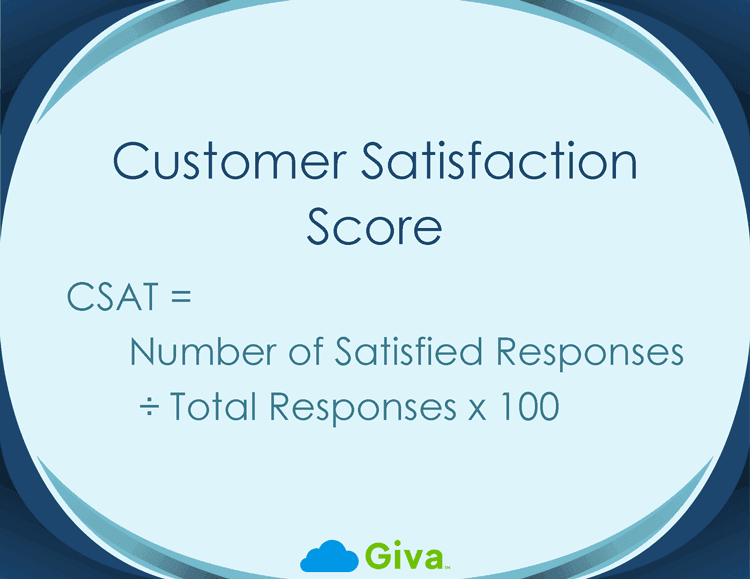
- Customer Satisfaction Score (CSAT) measures satisfaction with a specific interaction or touchpoint. A customer rates their experience on a 1-5 scale immediately after a purchase, support call, or other event. This is focused, transactional, and fast to collect.
- Customer Effort Score (CES) measures how easy it was for a customer to accomplish something, such as resolving a support ticket or completing a purchase. The question is typically phrased as "How easy was it to resolve your issue?" on a 1-7 scale. Research suggests that lower customer effort is a stronger predictor of loyalty than high satisfaction alone.
NPS, CSAT, and CES Compared
Feature |
NPS |
CSAT |
CES |
What It Measures |
Long-term loyalty / advocacy |
Satisfaction with a specific interaction |
Ease of completing a task or getting help |
Scale |
0-10 |
1-5 |
1-5 or 1-7 |
Survey Timing |
Periodic (quarterly or annual) |
Immediately after an interaction |
Immediately after a task or interaction |
Primary Use |
Strategic benchmarking, brand health |
Monitoring quality across touchpoints |
Reducing friction, improving UX |
Answers the Question |
"Would they recommend us?" |
"Were they satisfied?" |
"Was it easy?" |
The most complete view of customer experience comes from using all three:
- Run NPS periodically to track the health of your overall relationships
- Use CSAT after every support interaction to catch service quality issues early
- Use CES to identify where processes are unnecessarily complicated
Giva's CSAT vs NPS vs CES guide covers the calculation formulas and tradeoffs in detail.
Employee Net Promoter Score (eNPS)
The same NPS methodology can be applied internally to measure employee engagement. Employee Net Promoter Score (eNPS) asks employees a single question: "On a scale of 0 to 10, how likely are you to recommend this company as a place to work?" Responses are grouped into Promoters, Passives, and Detractors using the same thresholds, and the score is calculated the same way.
Overall eNPS averages run lower than customer NPS benchmarks. A score of 10 to 30 is generally considered good for employee surveys, and anything above 50 is excellent. The overall industry benchmark across organizations that measure eNPS sits around 12 to 14.
There is an indirect connection between eNPS and NPS worth noting. Gallup's research on employee engagement found that customer satisfaction is approximately 10% higher in businesses with highly engaged employees. Disengaged employees produce inconsistent, low-effort customer interactions, which shows up in customer NPS scores over time. Tracking both gives leadership a fuller picture of organizational health.
7 Limitations of Net Promoter Score to Keep in Mind
NPS has earned its place as the most widely used loyalty metric for good reasons. It is also though frequently oversold. Understanding where the metric falls short helps you use it more effectively and avoid conclusions the data cannot support:
- Information loss from score grouping: Treating every score from 0 through 6 as an identical "Detractor" collapses a lot of variation. A customer who gives a 6 has a very different experience than one who gives a 0. This restriction creates a simpler number but discards information that a mean-score or top-box calculation (which counts only the top 1-2 scores as positive and reports that percentage, retaining more variation across the scale) would preserve.
- No diagnostic depth: NPS tells you the ratio of Promoters to Detractors but does not tell you why. A score of 20 could reflect problems with your product, your pricing, your support, or your onboarding, and the number alone cannot distinguish between them. The open-ended follow-up question is essential, not optional.
- Cultural variation: NPS responses differ significantly across countries, independent of actual product quality. Respondents in the United States, India, and Latin America tend to score higher. Respondents in Japan, South Korea, and parts of Northern Europe tend to score more conservatively, even for brands they like. Cross-regional NPS comparisons require caution.
- Survivorship bias: NPS surveys only reach customers who are still around. Customers who churned before the survey was sent are excluded entirely. This means a rising NPS can sometimes coincide with a shrinking customer base if the most dissatisfied customers are leaving before they get the chance to score you.
- Gaming risk: Teams that are measured on NPS have an incentive to select who receives the survey. Sending surveys only to recently satisfied customers, or only after positive interactions, inflates the score without improving the actual experience.
- Declining response rates: Email survey response rates have dropped significantly over the past decade, and NPS surveys are not immune. Lower response rates reduce statistical reliability and increase the risk that respondents are not representative of the full customer base. Tracking NPS over multiple time iterations, rather than treating any single result as definitive, is especially important for this reason.
- Academic debate: Peer-reviewed research has questioned whether NPS is a better predictor of business growth than other loyalty metrics, such as overall satisfaction or the American Customer Satisfaction Index. The original 2003 Bain research was not published in peer-reviewed form, and several academic studies have found that NPS offers similar predictive value to simpler measures. This does not make NPS useless, but it does mean the "one number you need" framing has been challenged.
None of these limitations make NPS the wrong choice. They do mean it works best as one metric in a broader measurement program, not as the sole indicator of customer health.
7 Common NPS Mistakes to Avoid
Here are a few cautions to keep in mind in your NPS strategies:
- Surveying only after positive interactions, which inflates scores and undermines the reliability of the data over time.
- Forgetting the follow-up question, or making it optional in a way that most respondents skip. The open-ended "why" is where the actionable insight lives.
- Treating NPS as a final score rather than a starting point. A score of 40 means nothing without a plan for what to do with the Detractor feedback that produced it.
- Running NPS too frequently in relational mode. Quarterly is appropriate for most organizations; monthly relationship surveys cause survey fatigue and lessen response rates.
- Combining relational and transactional scores into a single overall NPS number, which produces a metric that is neither a reliable measure of overall loyalty nor a reliable measure of specific interaction quality.
- Presenting NPS results without segment breakdowns. An average score of 35 can hide a cluster of enterprise accounts at -10 sitting alongside a large base of SMB customers at 55. Those two groups need entirely different responses.
- Setting NPS targets without benchmarking against industry peers first. A target of 50 is reasonable in consulting but is far out of the question for internet software. Targets set without context lead to either complacency or demoralization.
Net Promoter Score FAQs
-
Is a negative NPS bad?
A score below 0 means more customers are Detractors than Promoters. That warrants attention, but the severity depends on your industry. Construction averages around 34, internet software averages 16, and some internet service providers (ISPs) and cable providers regularly sit in negative territory.
The first question to ask is not "is this bad?" but "how does this compare to our direct competitors?" If your competitors all sit between -5 and +5 and you are at -3, the problem is industry-wide, not specific to your organization.
-
How often should you run an NPS survey?
For relational NPS, quarterly is the most common cadence, with annual also being widely used. Running it more frequently than quarterly in relationship mode tends to produce survey fatigue, lower response rates, and noisier data.
For transactional NPS, the survey is triggered by a specific event (a support ticket closing, a purchase completing) and can run continuously as long as the same customers are not surveyed too frequently across all channels. Most teams apply a minimum 30-day gap between any two surveys sent to the same customer, regardless of channel, to keep response rates healthy.
-
What should you do with NPS results?
The sequence that produces results is:
- Segment responses by Promoter, Passive, and Detractor.
- Close the loop with Detractors within 24 to 48 hours.
- Identify recurring themes across open-ended responses.
- Share findings cross-functionally.
- Set specific improvement targets tied to the root causes the data identified.
-
What is the difference between NPS and eNPS?
NPS measures customer loyalty by asking how likely customers are to recommend the company to others.
eNPS measures employee engagement by asking the same question about the company as a workplace.
Both use a 0-10 scale with the same Promoter/Passive/Detractor categories and the same -100 to +100 range. The audience is different. One surveys customers, the other surveys employees.
-
Can NPS predict customer churn?
Detractors churn at significantly higher rates than Promoters, so a rising percentage of Detractors in a specific customer segment is a reliable early warning. NPS alone is not a precise churn model, and should be paired with behavioral signals (login frequency, feature usage, support ticket volume) for a more complete picture. A drop in NPS among a high-value customer segment is worth investigating immediately, even if no accounts have churned yet.
-
What is a good NPS score for a help desk or IT service desk?
In IT support environments, a score above 25 is generally considered good, and above 50 is excellent. End users often contact support when something has already gone wrong, which creates a harder starting condition than, say, a post-purchase survey. That context matters when setting targets. Tracking NPS alongside First Contact Resolution (FCR) and average handle time gives a more complete operational picture than NPS alone.
Related Giva Resources
- Customer Satisfaction Metrics: Top Measurements + How-To's
- 15 Top Strategies to Ensure Customer Satisfaction
- 23 Traits of Customer Service Excellence Plus How-to Steps
Using Net Promoter Score to Build Real Customer Loyalty
NPS has earned its place as the dominant loyalty metric not because it is perfect, but because it is useful. A single, consistent question asked across your customer base gives you a comparable signal over time, a way to benchmark against your industry, and a clear starting point for understanding what your customers actually think about you.
The score matters less than what you do with it. Organizations that improve their NPS over time are usually not the ones obsessing over the number. They are the ones reviewing Detractor feedback every week, routing follow-up calls within 48 hours, and pushing themes into product and operations conversations where they can actually change something. That is the difference between NPS as a reporting exercise and NPS as a genuine management tool.
Use NPS alongside CSAT and CES for a complete picture, acknowledge its limitations when interpreting results, and treat every score drop as a question to investigate rather than a problem to explain away. That approach turns a simple 0-to-10 question into a meaningful window into the health of your customer relationships.
Giva Helps You Streamline Support So You Can Act on Customer Loyalty Data
Measuring NPS is only the beginning. The teams that improve it consistently share one trait. They act on feedback quickly, across functions, without losing track of which customers need follow-up.
- Giva's ticketing system, with customizable dashboards, and customer self-service portal have an easy-to-use and intuitive interface, allowing agents to quickly service customers, and customers themselves to self-serve.
- AI Copilots for tickets and knowledge base summaries create an even smoother experience.
Let Giva partner with your support teams! Get a demo to see Giva's solutions in action, or start your own free, 30-day trial today!


Categories: Help Desk, Customer Service