Customer Effort Score (CES): How to Calculate, Measure and Improve Plus Industry Benchmarks
 By Ron Avignone
What is Customer Effort Score?
Customer Effort Score (CES) is a customer experience survey metric that measures the perceived effort customers must exert to use a company's product or service, or request support. CES metrics are collected via surveys across various touchpoints in a customer's journey. Lower effort correlates directly with higher customer retention, making CES one of the most actionable metrics a support team can track.
For example, you've just moved into a new home and need to set up a new account with the local utilities company. The effort you must invest, or the ease or difficulty of that process, will comprise the CES you submit for that service.
In addition to reflecting the perceived effort on behalf of the customers, analyzing CES metrics can reveal how efficient your operations are (or are not). And help find ways to lower costs and retain employees.
Developed in 2010 by the Corporate Executive Board (CEB, now part of Gartner), CES emerged from research published in the Harvard Business Review article "Stop Trying to Delight Your Customers", which found that reducing customer effort is a stronger driver of loyalty than delighting them.
How Do You Calculate and Measure Customer Effort Score?
CES is all about tracking customers' perceived effort. Someone's perceived effort is reflected in their responses to a customer experience survey. Usually, the survey is delivered directly after the interaction.
For example, you can be redirected to a survey after a phone call, or a survey question can pop up in the customer service chat box after the agent has disconnected.
-
CES Formula
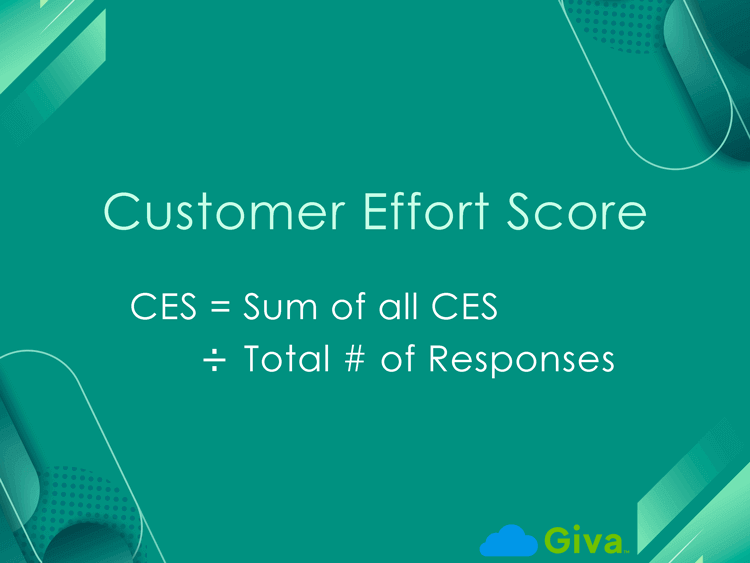
A Customer Effort Score can be calculated by summing all CES scores and dividing by the total number of responses:
CES = Sum of all CES / Total # of Responses
For example, you received 10 survey responses to your five-point CES scale: 2, 4, 4, 5, 3, 2, 3, 4, 4, 5.
So, (2+4+4+5+3+2+3+4+4+5) / 10 = (36) / 10
Therefore, your CES is 3.6 out of 5.
For surveys that use an agreement scale, such as "Strongly Agree" to "Strongly Disagree", CES can also be expressed as a percentage using an alternative calculation:
(Total Positive Responses / Total Responses) x 100
A result of 80% or higher is generally considered a strong score on this scale.
-
CES 1.0 vs CES 2.0: How the Survey Question Evolved
The original CES framework, now called CES 1.0, asked customers directly about their own effort level: "How much effort did you personally have to put forth to handle your request?" Responses used a 1-5 scale, where 1 was very low effort and 5 was very high effort. Lower scores were better.
In 2013, Gartner's CEB research team updated the approach with CES 2.0. The revised question shifts to an agreement statement: "The company made it easy for me to handle my issue." Customers respond on a 1-7 scale from "strongly disagree" to "strongly agree," where a higher score is better.
The change addressed a known flaw in CES 1.0, which was asking customers to self-assess their own effort introduced ambiguity. Two customers with identical experiences could interpret "effort" differently. The agreement format is more consistent, and the 7-point scale provides more granularity than the original 1-5 range.
Most organizations today use the CES 2.0 question format, though you will encounter both in software platforms. When benchmarking your scores against industry data, always confirm which question format and scale the benchmark uses, as comparing a CES 1.0 score against CES 2.0 benchmarks produces a misleading result.
Version
Question Approach
Scale
Better Score
CES 1.0 (2010)
Self-rated effort ("How much effort did you personally have to put forth?")
1-5 (low to high effort)
Lower
CES 2.0 (2013)
Agreement statement ("The company made it easy for me to handle my issue.")
1-7 (disagree to agree)
Higher
-
CES Survey Examples
A Likert scale accompanies the CES survey question. The precise language of a CES survey question may vary. Here are Customer Effort Score survey examples:
-
For support interactions:
- CES 1.0: "How easy was it to resolve your issue today?" (1-7 scale, higher = easier)
- CES 2.0: "To what extent do you agree: [Company] made it easy for me to handle my issue." (1-7 agreement scale)
-
For product and onboarding:
- CES 1.0: "How easy was it to get started with [product name]?" (1-7 scale)
- CES 2.0: "To what extent do you agree: [Product name] made it easy for me to get started." (1-7 agreement scale)
-
For self-service and help center:
- CES 1.0: "How easy was it to find the information you were looking for?" (1-5 scale)
- CES 2.0: "To what extent do you agree: [Company] made it easy for me to find what I needed in the help center." (1-7 agreement scale)
-
For purchases and checkout:
- CES 1.0: "How easy was the purchasing process today?" (1-7 scale)
- CES 2.0: "To what extent do you agree: [Company] made it easy for me to complete my purchase." (1-7 agreement scale)
-
For returns and account management:
- CES 1.0: "How easy was it to complete your return / update your account information?" (1-7 scale)
- CES 2.0: "To what extent do you agree: [Company] made it easy for me to complete my return / update my account." (1-7 agreement scale)
- Standard follow-up prompt (any category): After the scale response, add an open-ended "What made this interaction easy or difficult?" question to give the score actionable context.
While the questions themselves may vary from company to company, the goal remains the same: reduce the effort your customers need to exert when interacting with your company.
-
For support interactions:
What is a Good CES Score?
With CES scores, the higher the better. High CES scores reflect that your customers believe doing business with your company is easier rather than harder.
A Customer Effort Score benchmark will depend on the precise scale you are deploying (e.g., a five or seven-point scale). CES scores may also vary based on the industry you're in, the type of interaction, and the wording you utilize.
- Industry and interaction variations: Industries with less complex interactions tend to have higher Customer Effort Scores (e.g., E-commerce), whereas highly technical industries tend to have lower scores (e.g., B2B support).
- Wording variations: The wording you select will determine whether you want a higher or lower CES. For example, if you're measuring "effort," you want a low score, but if you're measuring "ease", then higher is better.
CES Scales and Benchmarks |
||
Scale Type |
Description |
Customer Effort Score Benchmark |
Five-point scale |
1 to 5, with 1 representing the highest level of disagreement with the statement. |
4 or higher |
Seven-point scale |
1 to 7, with 1 representing the highest level of disagreement with the statement. |
5.5 or higher |
0 to 100 % agreement scale |
|
80% or higher |
Customer Effort Score Benchmarks By Industry
Customer effort levels can vary based on industry, scale type, question phrasing, and customer expectations. But it's helpful to work with some benchmark estimates.
Industry Type |
CES Scale |
CES Benchmark |
Utilities |
1-7 |
5.0 to 5.4 |
Government |
1-6 |
4.0 to 5.0 |
Healthcare |
1-7 |
5.0 to 5.6 |
Insurance |
1-5 |
4.0 to 4.4 |
Banking |
1-5 |
4.2 to 4.6 |
SaaS or B2B |
1-7 agreement scale |
5.5 to 6.2 |
What you might have noticed from this table is that no industry is perfect and that there is always room for improvement.
Further, industries needing more human involvement like healthcare or government typically have more complex processes, leading to slightly lower CES averages, whereas, e-commerce and SaaS companies leverage automation and self-service to reduce friction, resulting in higher CES benchmarks.
How To Improve Customer Effort Score Benchmarks
-
Streamline Your Customer Service Experience
Examine your typical customer journey and mitigate the friction in your process.
- Simplify transfers
- Eliminate redundant steps
- Offer callback options instead of waiting on hold
- Eliminate the need to repeat information between agents to decrease handle time
- Automatically route customers to the right department or skill set
-
Rely on Proactive Communication
If your customers are out of the loop on your products or services, they'll have to work harder. That's why proactive communication can help keep their experience low-effort.
For example, proactive alerts, updates, and confirmation emails are helpful. This is especially true for longer processes, such as returns or account approvals, or for complex problems that require ongoing troubleshooting.
-
Offer Nuanced Self-Service Options
One of the most effortless ways customers interact with your business is by self-service.
Therefore, it's critical to optimize your FAQ pages, AI chatbot technology, and knowledge bases like blogs. To do this, track customer interactions to identify where customers abandon self-service options.
-
Train and Coach Customer Service Agents
A lot of customer frustration and the ensuing effort stem from poorly trained agents who offer inconsistent or confusing support. Therefore, you can eliminate a lot of the extra effort by effectively onboarding and training personnel. Furthermore, you can remain invested in their performance through coaching.
-
Track CES Trends Over Time
To truly understand and improve your customer experience, it's essential to track Customer Effort Score trends over time.
Start by reviewing your CES data monthly or quarterly to identify recurring pain points or sudden changes in effort levels. For example, if your CES dips after a new product release or system update, that's a strong indicator that your process needs refinement.
Beyond tracking averages, look for trends across specific touchpoints, such as onboarding, billing, or support. This will help show you exactly where customers are experiencing unnecessary difficulties.
It's also helpful to view CES in light of other Key Performance Indicators (KPIs), such as First Contact Resolution (FCR), Average Handle Time (AHT), and Customer Satisfaction (CSAT). When you see high effort paired with low FCR or CSAT, you've found an area for improvement.
-
Leverage AI Agents to Detect High-Effort Interactions in Real Time
Standard CES surveys capture effort after the fact, where the customer has already had a frustrating experience before you learn about it.
AI Agents can shift this from reactive to proactive. By monitoring conversations, sentiment signals, and interaction patterns in real time, AI Agents can flag interactions that are trending toward high effort, such as long hold times, repeated transfers, unresolved queries after multiple turns. They can then trigger escalation or intervention before the customer disengages.
Post-interaction, AI Agents can also automate CES survey delivery at the right channel and right moment, reducing the gap between interaction and feedback.
And further, some platforms use AI to infer an effort score from the interaction transcript directly, supplementing manual survey responses with signal-based scoring across every conversation, not just the subset where customers choose to respond.
Integrating AI Agents into your support workflow means your CES data becomes richer, more timely, and more actionable, particularly for high-volume environments where manual survey response rates are low.
CES vs. NPS vs. CSAT: What's the Difference?
Customer Effort Score is one of three widely used customer experience metrics, alongside Net Promoter Score (NPS) and Customer Satisfaction Score (CSAT). Each measures something distinct:
- CES measures how easy a single interaction was. It answers, "Was this interaction low-effort for the customer?"
- NPS measures overall brand loyalty and likelihood to recommend. It answers, "How does the customer feel about us as a whole?"
- CSAT measures satisfaction with a specific outcome or service interaction. It answers, "Was the customer satisfied with this result?"
Used together, the three metrics provide a fuller picture of the customer experience. CES is particularly valuable for finding friction in specific touchpoints, such as support calls, onboarding flows, or returns, where reducing effort directly impacts loyalty and retention.
Here is a quick reference comparison of the three metrics:
Metric |
What It Measures |
When to Survey |
Scale |
Best For |
CES |
Ease of a single interaction |
Immediately after a touchpoint |
1-7 agreement |
Pinpointing friction in specific customer journeys |
NPS |
Overall brand loyalty |
Periodically (quarterly or annually) |
0-10 |
Predicting revenue growth and word-of-mouth |
CSAT |
Satisfaction with a specific outcome |
Immediately after a transaction |
1-5 or % satisfied |
Evaluating product, support, or service quality |
Learn more from our blog post CSAT vs. NPS vs. CES: How to Calculate Plus the Pros and Cons of Each.
How to Run a CES Survey
With CES surveys, timing is everything. The goal is to deliver a CES survey at key touchpoints throughout a customer's journey.
- During support tickets
- Returns
- Purchases
- Onboarding flows
You want to deliver the CES survey quickly so the customer's experience remains fresh. You'll get the most valuable data when the customer can remember precisely how the interaction went.
When writing your CES survey question, keep the language simple and unambiguous. Avoid technical jargon or questions that ask about two things at once. The clearer the question, the more reliably it captures actual customer effort rather than confusion about what is being asked.
Another important component to consider for running CES surveys is that you want to deliver the survey via the same channel through which the original interaction occurred. For example, if your customer service team interacts with customers by phone, the CES survey should be delivered by phone.
Other channels you can deliver CES surveys include email, chat, and directly through a product or service's app.
Limitations of CES to Keep in Mind
CES is a valuable but narrow metric. Knowing its limitations helps you decide when to use it, when to supplement it, and how to interpret outlier scores:
- Single-touchpoint focus: CES measures one interaction in isolation. A customer who rates a specific support call as low-effort may still churn if their overall product experience is frustrating. CES will not capture that.
- No context on the "why": A CES score tells you how much effort was involved, not why. A score of 2 on a 7-point scale could reflect a confusing IVR, an undertrained agent, a policy customers find unfair, or an inherently complex issue. Without a follow-up open-ended question, the score is directional but not diagnostic.
- Post-interaction timing bias: Surveying immediately after an interaction captures the customer at their most emotionally reactive moment. A customer who received a correct but slow resolution may rate effort higher than one who received a fast but incorrect answer, distorting the signal.
- Limited cross-session correlation: CES does not capture cumulative effort. A customer who contacts support three times for the same issue, each rated individually as moderate effort, will show three average scores, not one that reflects the cumulative frustration of repeated contact. Pairing CES with a repeat-contact rate metric addresses this gap.
Software That Helps Calculate, Track, and Improve CES
Our hypothetical CES example from above, with ten survey responses, helped demonstrate a simple CES formula application, but let's be honest, it's not realistic. In real business, you're going to have exponentially more than ten responses, the math will be more complex, and collecting and analyzing the data will be cumbersome.
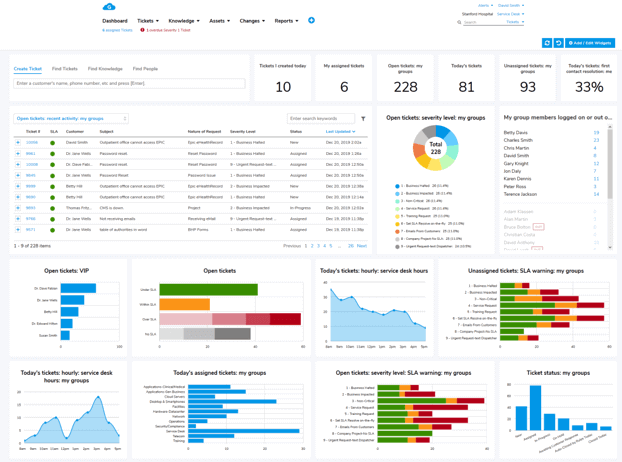
That is, unless you equip yourself with the best possible customer service software tools, like Giva's AI-Powered and HIPAA Compliant Customer Service Software. Giva's software is quick to set up. Once it's up and running, it facilitates real-time monitoring and reporting of your customers' experience.
-
Improve First-Contact Resolution and Response Times
You can have instant visibility of all customer service issues. This empowers customer service personnel and helps facilitate higher first-contact resolution rates and shorter response times.
-
Increase Customer Satisfaction with Proactive Issue Monitoring
With Giva's customer service software, you can rapidly identify problematic emerging trends in your customers' journey. This will allow you to take action before overall customer satisfaction is negatively affected.
-
Optimize Agent Performance
The software offers real-time data on agent performance. This helps managers adjust staffing, optimize workloads, and reassign tasks. The result is ensuring that all agents are as focused and productive as possible.
Low-Effort Customer Experiences Drive Customer Loyalty
Effort matters because it's a driver of customer loyalty (and disloyalty). According to Gartner, 96% of customers who exert high effort for a service become more disloyal compared to just 9% of customers who exert low effort.
That pattern shows up consistently in recent consumer research. 81% of consumers say they want service interactions to continue where they left off, without having to backtrack from a previous interaction.
And, according to Zendesk's CX Trends 2026 report, based on a survey of more than 11,000 consumers and business leaders across 22 countries, 74% of customers find it frustrating to have to tell their story over and over to different agents, and 85% of CX leaders say customers will drop brands over unresolved issues, even on the first contact.
But Why Else is CES Important?
- Predicts loyalty: CES is a stronger predictor of customer loyalty than satisfaction scores alone. Lowering effort reduces churn and encourages repurchasing.
- Drives positive word of mouth: Customers are more likely to speak positively about low-effort companies, and less likely to warn others away.
- Provides actionable insights: CES pinpoints specific areas of friction in the customer journey, giving teams a clear target for improvement rather than a general satisfaction score.
- Lowers operating costs: High-effort interactions, which are those involving hold times, repeated contacts, and channel switching, cost more to handle. Reducing effort lowers cost per interaction.
- Supports employee retention: Streamlined, efficient processes make agents' jobs easier and more satisfying. Happier employees stay longer.
- Reduces interaction costs: Low-effort interactions require fewer follow-up contacts, shorter handle times, and less escalation. For support teams managing high volumes, CES improvement initiatives directly reduce cost per contact, not just satisfaction scores.
Customers Deserve Low-Effort Experiences
Customer effort level is an indicator of how easy or difficult a company's services are. High-effort companies have clunky operations and obstacles like long wait times, repeats, and transfers. On the other hand, low-effort companies have streamlined processes that deliver effective customer service.
A low-effort experience is better for customers and your business. They deserve it. And you do too. Plus, who doesn't love a win-win combo?
Giva Can Help Your Customers Experience Less Effort
Giva's ticketing system, with customizable dashboards, and customer self-service portal have an easy-to-use and intuitive interface, allowing agents to quickly service customers, and customers themselves to self-serve.
AI Copilots for tickets and knowledge base summaries create an even smoother experience.
Let Giva partner with your support teams! Get a demo to see Giva's solutions in action, or start your own free, 30-day trial today!


Categories: Help Desk, Customer Service