35 Unique Help Desk Metrics for the Best Agent Performance
 By Ron Avignone
Measuring help desk agent performance effectively is important for monitoring efficiency of support teams. By tracking key help desk metrics, organizations can gain valuable insights into their help desk operations.
This article offers unique and granular metrics that help desks can use to improve service quality and drive continuous improvement.

What are Help Desk Metrics?
Help desk metrics are quantifiable measures used to assess the performance and effectiveness of a help desk, service desk, or support team. These metrics provide insights into various aspects of the help desk's operations, even to the agent level, such as how quickly issues are resolved, the quality of service provided, and the overall satisfaction of the users.
Help Desk Metrics vs. Help Desk KPIs: What's the Difference?
A metric is any number you can measure. A Key Performance Indicator (KPI) is the much smaller set of metrics tied to a target someone is accountable for hitting.
The distinction is important here because the measures in this article are metrics, not KPIs, and most of them never should be. They are deliberately granular and agent-level, built for diagnosing a problem rather than for reporting upward. A manager who puts all 35 of them into a monthly report will lose the audience by the second page during a presentation.
Used as intended, these granular numbers sit underneath a much smaller set of KPIs and explain what those KPIs cannot. If you are looking for the strategic set rather than the diagnostic one, see Most Important Operational Metrics & KPIs.
The Importance of Tracking Help Desk Metrics
Tracking help desk metrics is beneficial for several reasons:
- Performance Monitoring: Metrics provide a clear picture of how well the help desk is performing. They can help identify areas where the team excels and where improvements are needed.
- Resource Allocation: By understanding ticket volumes and resolution times, among other measurements, organizations can better allocate resources to ensure efficient handling of support requests.
- Customer Satisfaction: Regularly measuring and analyzing customer satisfaction helps in understanding user perceptions and improving the quality of service.
- Continuous Improvement: Metrics highlight trends and patterns that can inform process improvements, training needs, and technological upgrades.
- Accountability: Metrics establish accountability by setting performance benchmarks and goals for the help desk team.
- Strategic Decision-Making: Data-driven insights from metrics support strategic decisions that enhance overall help desk efficiency and effectiveness.
35 Unique Help Desk Metrics for Support Teams and Managers
The following is a list of low-level metrics by agent that help desk support managers could find very beneficial in assessing their agents while supervising and guiding their help desks:
- # of Tickets Created
-
# of First Contact Tickets
A First Contact Resolution (FCR) ticket is closed while it is created. Tickets created via email cannot be FCR unless a closed status is configured in the rules for converting emails into tickets.
- % of First Contact Tickets
- # of First Contact History Notes By the Agent as the Creator
- # of Not First Contact Tickets
- % of Not First Contact Tickets
- # of Non First Contact History Notes By the Agent as the Creator
- # of Tickets Accessed By the Agent as the Ticket Creator
- # of History Notes Added While Creating Tickets
- # of History Notes By the Agent as the Ticket Creator
- # of Tickets Accessed By the Agent When Not the Ticket Creator
- # of History Notes Created by the Agent When Not the Ticket Creator
- Total # of History Notes
- Average Customer Satisfaction Survey Rating
- # of Tickets Closed under SLA
- # of Tickets Closed having an SLA
- % SLA Compliance of Last Assignee
- Average Time-to-Create Tickets
- Average Time-to-Close Tickets
- # of Tickets Closed
-
# of Ticket Assignments
The total number of ticket assignments to an agent by other agents, system automation or through self-assignment.
-
# of Reassignments
The number of times an agent reassigned any ticket that was assigned to them.
-
# of Reassignments Within 45 minutes of SLA Resolve Time
The number of times an agent reassigned a ticket to a different agent within 45 minutes of SLA Resolve time.
-
# of Reassignments After SLA Resolve Time
The number of times an agent reassigned a ticket to a different agent after the SLA Resolve time had passed.
-
# of Reassignments an Agent made to a ticket assigned to them; Agent made no changes to ticket
The number of times an agent reassigned a ticket that was assigned to them, but they did not make any other non-assignment related changes to the ticket.
-
# of Reassignments to a different Service Group (Help Desk, Facilities, etc.) when ticket is not assigned an Agent; Agent made no changes to ticket
The number of times an agent reassigned an unassigned ticket to a different Service Group, but they did not make any other non-assignment related changes to the ticket.
-
# of Assigned Tickets Awaiting Action
The number of tickets assigned to an agent awaiting action. Assignment was by other agents, system automation or through self-assignment.
-
# of First Actions Taken After Reassignment
The number of first actions taken by an agent to perform any update on a ticket after they have become the assignee. (Does not include all actions taken on the ticket. Only the first action after each reassignment.)
-
Average Time Elapsed Before Agent Takes First Action
The average time taken by an agent to perform an initial update on a ticket after they have become the assignee. (Does not include all actions taken on the ticket. Only the first action after each reassignment.)
-
# of SLA Resolve Time Extensions When Not Assignee
The number of times an agent extended or removed the SLA Resolve time when not the assignee.
-
# of SLA Resolve Time Extensions When Assignee
The number of times an agent extended or removed the SLA Resolve time when the assignee.
-
Total # of SLA Resolve Time Extensions
The number of times an agent extended or removed the SLA Resolve time.
- # of Knowledge Articles Created
- Average Rating of Knowledge Articles Created by the Agent
- Total Problem Solving Score of Knowledge Articles Created by the Agent, which is based on how many times the article was used to resolve a ticket.
How These Help Desk Metrics Roll Up Into the KPIs You Report
Most of the measures above are never reported on their own. They feed into a much smaller set of KPIs:
For example:
- # of Tickets Closed under SLA, # of Tickets Closed having an SLA and % SLA Compliance of Last Assignee roll up into SLA compliance
- Average Customer Satisfaction Survey Rating feeds Customer Satisfaction (CSAT)
- # of First Contact Tickets and % of First Contact Tickets feed First Contact Resolution
- Average Time-to-Create Tickets and Average Time-to-Close Tickets feed response and resolution time
- The reassignment counts do not roll up into anything. They explain a resolution-time problem that the resolution-time KPI will show but never account for
That last group is the practical argument for tracking metrics at this level of detail. A KPI tells you that something moved. These tell you why it moved, and in which queue or with which agent.
Deciding which of these numbers goes to which audience, and how often, is a separate question. See Help Desk Reporting for matching report to audience.
Conclusion: Low-Level Help Desk Metrics for High-Level Service
Help desk metrics are indispensable tools for evaluating and enhancing the performance of support teams. By consistently tracking and analyzing key metrics, organizations can ensure they deliver high-quality support, meet customer expectations, and drive continuous improvement.
Implementing a robust metrics tracking system can help identify areas for enhancement and help in making informed, strategic decisions that contribute to the overall success of the help desk. Investing in these metrics ultimately leads to a more responsive, efficient, and customer-centric support operation.
Does Your Help Desk Solution Provide These Kind of Metrics? Giva Does!
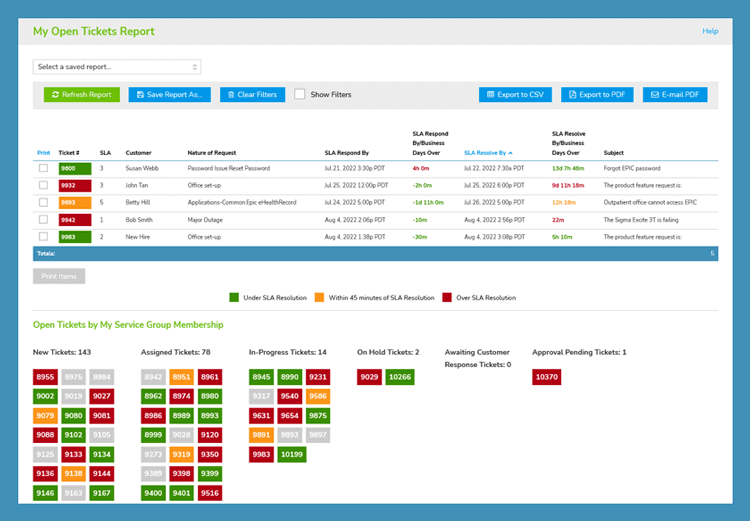
Giva's help desk software with Staff Performance Reports give help desk managers the granular metrics they need to reward top agents and identify areas of improvement.
Here's our video of these reports:
Let Giva's reporting and metrics be your guide to a continuous improvement of help desk operations! Book a free Giva demo to see our solutions in action, or start your own free, 30-day trial today!


Categories: IT, Help Desk