B2B Customer Journey Mapping: A Practical Guide to Managing the Buying Committee
A mid-market software deal can look simple from the outside. Before purchase, an IT manager requests a demo and a CFO reviews the contract, and after purchase and six weeks after go-live, a help desk ticket comes in from an end user who was never trained on the new system. Three different people, three different times in the process, three completely different interactions, and all three are part of the same B2B customer journey.
Most companies can see each of those moments on their own. Almost none of them connect the three. This guide is built around bringing them all together. It walks through the five stages a B2B account actually moves through, and who tends to be in the room at each one. It also introduces a framework called the Committee Handoff Grid, which tracks where those stages and stakeholders intersect, along with a practical process for building a map that still works six months after the signature, not just on the day the deal closes.
Key Takeaways
- The buying committee is bigger than one signature: A complex B2B purchase is decided by a room of stakeholders, not a single buyer, and each one experiences a different part of the journey.
- Handoffs break journeys more than stages do: The riskiest moments in a B2B account are not the five stages themselves. They are the points where a different stakeholder takes over, especially the shift from Decision to Onboarding.
- Post-sale data is the harder half to collect: Sales calls and marketing data cover Awareness and Consideration reasonably well, but the support tickets, escalation notes, and usage data that reveal Onboarding and Retention are usually scattered across different systems and owned by different teams.
- What's the fastest way to spot a broken handoff? Look at where reopened tickets, stalled deals, or a suddenly quiet contact cluster around a specific stage change, not within a single stage.
- A single persona can't stand in for a buying committee: Treating an IT evaluator, a budget signer, and a daily end user as one generic "buyer" hides the friction a journey map is supposed to find.
What Is B2B Customer Journey Mapping?
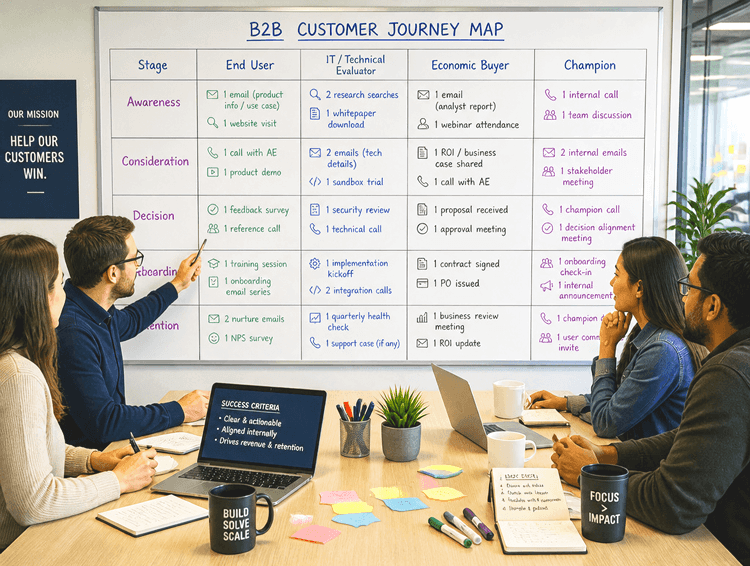
B2B customer journey mapping is the practice of documenting every touchpoint, stakeholder, and interaction a business account moves through, starting when a prospect first recognizes the problem your product solves, continuing through the purchase itself, and extending to renewal or expansion long after the deal closes.
It's not a single line either. A B2B account moves through this journey as a group, so the map has to capture what an entire buying committee experiences, and eventually what your own account team experiences too.
B2B vs. B2C Customer Journey Mapping: What's Different
A B2B customer journey involves multiple decision-makers, a longer sales cycle, and a relationship that continues well past the purchase, while a B2C customer journey usually involves one person making a faster, more personal decision that ends once the product ships.
Both kinds of journeys move through broadly similar phases, but the similarities mostly stop there once you look at who's actually involved.
The biggest difference is the number of people included. A consumer buying software for personal use might compare two options, check a few reviews, and pay with a credit card in the same sitting. A B2B purchase routes through an end user, a technical evaluator, a budget holder, and often a champion who has to sell the idea internally before anyone signs anything. The next section walks through each of those roles in detail.
And sales cycles compound the difference.
A B2C purchase might close in minutes. A complex B2B deal commonly takes three to nine months once security review, procurement, and contract redlines enter the picture. That timeline also does not include the months of research that typically happen before a prospect ever fills out a form. Most of that B2B data ends up living in a Customer Relationship Management (CRM) system, sales call notes, and support tickets, while B2C data is usually purchase history and reviews.
For the fuller history of how B2B buying moved away from a single, seller-controlled path, Giva's B2B Customer Journey vs. Experience Journey Mapping article covers that shift in more depth.
Here's how the two compare across the dimensions that matter most for mapping:
B2B vs. B2C Customer Journey Mapping at a Glance
Dimension |
B2B |
B2C |
|---|---|---|
Decision-Makers |
5 to 16 people across up to 4 functions (Gartner, 2025) |
Typically one person, occasionally a household |
Sales-Cycle Length |
Weeks to many months |
Minutes to a few days |
Touchpoint Formality |
Demos, security reviews, contracts, service agreements |
Product pages, reviews, checkout |
Relationship Duration |
Ongoing account relationship after purchase |
Often ends at the transaction |
Primary Data Sources |
CRM notes, sales calls, support tickets, usage data |
Purchase history, reviews, loyalty data |
The 5 Stages of the B2B Customer Journey
The B2B customer journey moves through five stages: Awareness, Consideration, Decision, Onboarding, and Retention.
Each stage brings a different set of people into the picture, and each one leaves a different kind of data behind.
Here's what happens at each stage, and where the data documenting it actually lives:
- Awareness: A company realizes it has a problem and comes across your brand while researching a fix, usually through content, search, or word of mouth.
- Consideration: The buying committee reads reviews and case studies, compares tools side by side, and checks pricing and security details before requesting a demo.
- Decision: The group agrees on a vendor, negotiates contract terms, and signs the deal, often after a security review and one or more rounds of contract redlines.
- Onboarding: Your team helps the new account set up the product, migrate data, and train end users before the account moves into daily use.
- Retention: The account uses the product day to day, reaches out for support when something breaks, and eventually decides whether to renew, expand, or leave.
The jump from Decision to Onboarding is where a lot of B2B relationships quietly lose momentum. The people who built the internal case for buying the product often are not the people using it every day, and if that handoff isn't deliberate, the account's understanding of the product can reset from scratch.
For the different journey map types themselves, rather than the B2B stages covered here, Giva's Customer Experience Journey Mapping: 5 Types, 8 Steps, and How to Drive Real Change article walks through all five.
The 5 B2B Journey Stages at a Glance
Stage |
What Happens |
Primary Data Source |
|---|---|---|
Awareness |
Company recognizes the problem and finds your brand |
Web and content analytics |
Consideration |
Buying committee compares options and requests demos |
Demo requests, sales call notes |
Decision |
Group negotiates terms and signs the contract |
Contract and negotiation notes |
Onboarding |
New account sets up the product and trains users |
Setup logs, support tickets |
Retention |
Account uses the product and decides to renew or expand |
Usage data, support history, renewal notes |
Who's in the Room: Mapping the B2B Buying Committee
A B2B buying committee typically includes an end user, an IT or technical evaluator, an economic buyer who controls the budget, and a champion who pushes the purchase forward internally, with procurement or legal sometimes stepping in as a fifth role in larger or regulated deals. Some sources call this whole group a Decision-Making Unit (DMU), though buying committee is the more common term in everyday use:
-
The End User
The end user is whoever actually works inside the product every day once it's live, and they're usually the first person to notice a problem worth solving.
In Awareness and Consideration, they're often testing free trials or building the internal case informally. By Onboarding, they need training and a reason to change how they already work, and if that training doesn't happen, they become the first support tickets Retention sees.
-
The IT or Technical Evaluator
The technical evaluator vets security, integrations, and data handling, and their sign-off is usually a hard requirement before a deal can close.
-
The Economic Buyer
The economic buyer controls the budget and has final sign-off on price, contract terms, and Return on Investment (ROI), though they rarely touch the product itself once it's purchased.
Their main appearance after Decision is the renewal conversation.
-
The Champion
The champion is the person inside the buying company who pushes the deal forward and defends it internally when questions come up.
Buying Committee Roles at a Glance
Role |
What They Care About |
Where They Typically Show Up |
Veto Power |
|---|---|---|---|
End User |
Ease of use, daily workflow fit |
Awareness, Consideration, Onboarding, Retention |
No |
IT / Technical Evaluator |
Security, integrations, data handling |
Consideration, Decision, Onboarding |
Yes |
Economic Buyer |
Price, contract terms, ROI |
Decision, Retention (renewal) |
Yes |
Champion |
Internal buy-in, proving the purchase was right |
Consideration through Retention |
Partial |
Procurement / Legal (larger or regulated deals) |
Contract terms, compliance, risk |
Decision |
Yes |
A single generic "buyer" persona flattens all four of these roles into one imagined person. The next section, the Committee Handoff Grid, is built specifically to pull them back apart.
The Committee Handoff Grid: A Framework for B2B Journey Mapping
Giva's Committee Handoff Grid maps the five B2B journey stages against the buying-committee roles covered above, so you can see exactly which role is active at each stage and where the handoff to the next one is most likely to break.
Most journey maps stop at showing that a stage happened. This one adds a second dimension of tracking who was actually paying attention during that stage.
The grid below shows the four roles from the previous section against each of the five stages:
Stage |
End User |
IT / Technical Evaluator |
Economic Buyer |
Champion |
|---|---|---|---|---|
Awareness |
Feels the problem, searches for a fix |
Not yet involved |
Not yet involved |
Often the end user, acting alone |
Consideration |
Tests free trials, compares usability |
Vets security and integrations |
Reviews pricing and ROI |
Builds the internal case |
Decision |
Rarely present at signing |
Signs off on technical fit |
Negotiates and signs the contract |
Coordinates internal approval |
Onboarding |
Learns the product, may resist change |
Leads setup and data migration |
Mostly disengaged until renewal |
Pushes adoption, handles pushback |
Retention |
Daily use, submits support tickets |
Handles technical escalations |
Reviews cost at renewal |
Advocates for renewal or expansion |
Where Do the Real Handoff Gaps Show Up?
-
The clearest breakdown sits in the Decision-to-Onboarding handoff for the technical evaluator. This is the person who vetted security and signed off on the technical checklist, and by the time Onboarding starts, they've frequently been reassigned to a different project or replaced by someone new to the account. Whoever picks up implementation on the vendor side often has to re-earn trust and re-explain decisions that were already settled months earlier.
This exact problem, losing context when an account moves from sales to a delivery or support team, is common enough that customer success platforms like Gainsight publish entire playbooks on operationalizing the sales-to-customer-success handoff.
The fix is a deliberate handoff rather than an assumed one. Before the technical evaluator disengages, put them on a short transition call with whoever owns Onboarding, and write down the specific technical decisions and constraints that were already agreed to, so the account isn't relitigating settled questions with someone new.
-
The economic buyer going quiet during Retention is the second one.
Once the contract is signed, the budget holder typically has no reason to check in until the renewal date approaches. If usage drops or support tickets pile up in the months in between, that information rarely reaches them until a renewal conversation is already underway, and by then, a change in course is much harder to make. A Quarterly Business Review (QBR), a recurring check-in with the account's stakeholders, gives the economic buyer a scheduled reason to hear about account health before the renewal date forces the conversation.
-
Champion turnover is the third, and it's the hardest one to plan for. A champion who leaves the company or changes roles between Decision and Retention takes their institutional knowledge of why the purchase happened with them. If nobody has documented that reasoning anywhere else, the account effectively starts over with whoever replaces them. Account-based marketing teams call this exposure "single-threading," when an entire deal rides on one contact. The best defense is multi-threading: keeping live relationships with more than one committee member instead of just the champion, so losing any single person doesn't erase the account's institutional knowledge.
There's no clean way to score exactly how risky a given handoff is. It depends on deal size, how replaceable the champion is inside their own company, and how well-documented the account already is, and different accounts will need different thresholds for what counts as a real risk versus a normal transition.
How to Build a B2B Customer Journey Map
Building a B2B customer journey map starts with narrowing the scope, then working through the committee, the real data, and the handoffs one step at a time.
The output is one grid, the same shape as the Committee Handoff Grid shown above, with the five stages across the top and the buying-committee roles down the side. Nobody builds a separate map for each customer, each role, or each stage. What changes between mapping projects is the scope, not the format.
Six steps make up a reliable process:
-
Set a Specific Goal or Scope
Pick a customer segment or account type to represent, such as mid-market SaaS accounts or a specific product line, rather than trying to build one map that covers every account at once. A journey map is a composite of a typical path through that segment, similar to a buyer persona, drawn from patterns across many real accounts.
For a first attempt, narrow further and scope the map to a single suspected problem instead of the full journey end to end, and that scope doesn't have to start at Awareness. A map scoped to "why do technical evaluators go quiet after Decision" is more useful on a first try than a company-wide map that tries to document every stage with equal depth, especially when Awareness and Consideration are already well understood from marketing and sales data.
-
Identify the Buying Committee for That Scope
List every role likely to be involved in that specific scope, using the four roles from the section above as a starting point. Not every deal has all four in a formal sense. A smaller company might have one person acting as both the technical evaluator and the economic buyer, and the map should reflect that instead of forcing roles that don't exist.
-
Pull Real Interaction Data Instead of Guessing
This step draws on a set of recent accounts that already went through the scope you picked, not one account still in progress. A dozen deals that already reached Decision reveal the real pattern, and a map can't be built by waiting for one new account to finish its journey first.
Sales call notes, support tickets, web or product analytics, and direct interviews with recent customers, including the deals you lost, tell you what actually happened. Guessing at pain points from memory tells you what someone assumed happened, and the difference between the two is usually bigger than teams expect going in.
The result is a forward-looking reference, not a one-time record. Once the pattern across those accounts is clear, the same map is what you check every new account against going forward, instead of learning the same lesson deal by deal.
-
List Every Interaction, Stage by Stage
Write down every email, call, chat, demo, support ticket, and invoice for the scope you picked, and note which stage and which role each one belongs to. An interaction belongs to a role whenever that role took part in it, sent it, received it, or was looped in, not only the ones that role personally started. This step is tedious, and it's supposed to be. The blind spots only become visible once the full list exists in one place, not scattered across a CRM, a support tool, and someone's inbox.
-
Run the Committee Handoff Grid
"Laying the data on the grid" means placing each interaction from the previous step into the stage-and-role cell it belongs to, the same five-stage-by-four-role layout shown earlier in this article, and then reading the pattern that emerges. An empty cell where you'd expect activity, or a stage where every interaction comes from only one role, is the signal to look at. The Decision-to-Onboarding handoff and the mid-Retention silence pattern described above are the two most common places a real problem turns up, but every account is different enough that a third, unexpected one is common too.
Once a cell flags a problem, the fix depends on which one it is, such as the ones noted above: a documented handoff for a disengaging role, a scheduled check-in like the QBR for a quiet economic buyer, or multi-threading for a champion at risk of leaving.
-
Assign an Owner and a Review Schedule
Name one person responsible for keeping the map current, even though several teams will feed data into it. Set a review point, tied to a renewal date or a fixed schedule such as every six months, so the map gets checked on purpose instead of forgotten until someone needs it for a different project.
Putting It Together: A Worked Example
Here's what these six steps look like end to end:
- A support team notices technical evaluators keep disappearing right after contracts get signed, so they scope the first map to exactly that: Decision through Onboarding, for mid-market accounts.
- They list the roles active in that window, the technical evaluator, the champion coordinating internally, and whoever picks up implementation on the vendor side. Then they pull the last dozen accounts that closed in the past two quarters, not a single account still mid-onboarding, and gather the CRM notes, the signed contracts, and the first 30 days of support tickets for each one.
- Every email, kickoff call, and support ticket from those accounts gets logged against its stage and role, then placed on the grid. The Decision column for the technical evaluator role turns out to be full of activity. The Onboarding column for that same role is nearly empty across all twelve accounts. That empty cell is a confirmed problem, not just a suspicion.
- The fix that comes out of it is a short, structured handoff call between the outgoing technical evaluator and whoever owns Onboarding, scheduled the same week a contract is signed, with a one-page summary of the technical decisions already made. The team assigns a named owner for the map and sets a review date six months out, when the next batch of closed accounts can confirm whether that empty cell actually filled in.
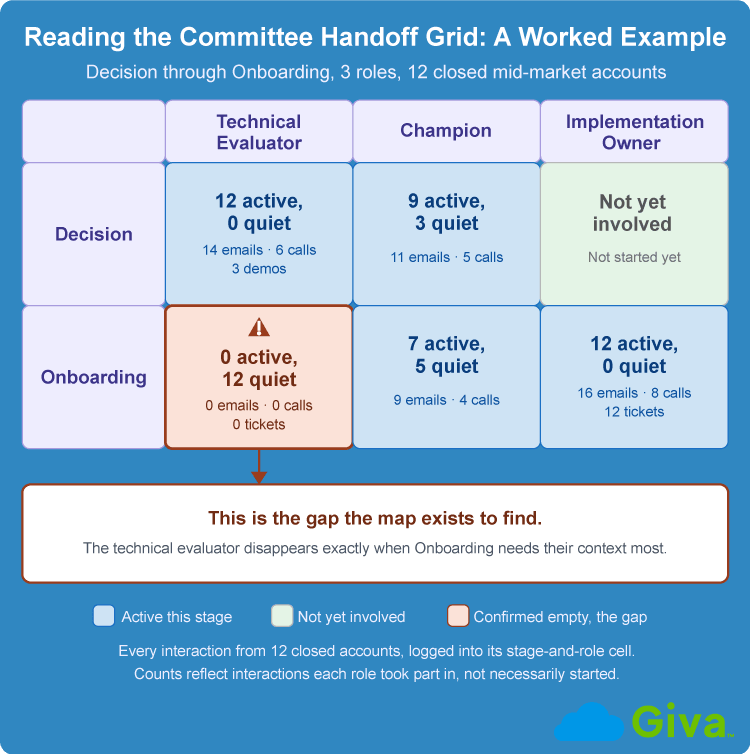
B2B Customer Journey Mapping Committee Handoff Grid Worked Example Diagram
Measuring Success: KPIs by B2B Journey Stage
The clearest way to measure a B2B customer journey map's success is to track one customer goal, one business goal, and one success metric for each of the five stages.
Each stage has its own Key Performance Indicators (KPIs), which are the specific numbers that tell you whether that stage is actually working. Treating all five stages as one big success metric hides which part of the journey needs attention, especially once you get to softer measures like Customer Satisfaction Score (CSAT), Net Promoter Score (NPS), or Customer Effort Score (CES) in the Retention stage.
Here's a stage-by-stage breakdown:
Stage |
Customer Goal |
Business Goal |
Success Metric |
|---|---|---|---|
Awareness |
Understand if this solves their problem |
Build a qualified pipeline |
Content engagement, qualified traffic |
Consideration |
Compare options and confirm fit |
Advance qualified opportunities |
Demo requests, stakeholder engagement |
Decision |
Get internal sign-off with minimal risk |
Close revenue |
Sales-cycle length, win rate |
Onboarding |
Get the product running and see value fast |
Protect the deal from early churn |
Time-to-value, setup completion rate |
Retention |
Get ongoing value and support |
Protect and grow the account |
Renewal rate, CSAT, NPS, CES, expansion revenue |
Retention-stage metrics can go much deeper than the table above, into account health scoring and net revenue retention across an entire customer base. That broader, account-level measurement strategy is covered in Giva's B2B Customer Experience Strategy: How to Design, Measure, and Scale Account-Level CX article. The table here is meant to stay at the single-map, stage-by-stage level.
6 Common Mistakes in B2B Customer Journey Mapping
The most common mistakes in B2B customer journey mapping come from treating a multi-stakeholder, multi-month process like a simple, single-person purchase.
Why do so many journey maps look great in the kickoff meeting and then never get opened again? Usually because one of the mistakes below crept in from the start.
Here are six mistakes that show up again and again once a map moves past the whiteboard stage:
- Mapping in Isolation: Marketing, sales, and support each build their own version of the journey from their own data, and none of the three ever gets compared against the other two.
- One Persona for the Whole Committee: Treating the end user, the technical evaluator, and the budget holder as one imagined buyer erases the real differences between them, the same distinction covered in detail in the Buying Committee section above.
- Guessing Instead of Pulling Real Data: Pain points get written down based on what the team assumes happened in a deal instead of what the sales notes, support tickets, and call recordings actually show.
- Treating the Map as a One-Time Deliverable: A map gets built once for a kickoff meeting or a planning offsite and is never opened again, even as the product, the pricing, and the buying committee itself change.
- Skipping the Post-Sale Stages: Many maps stop at the signature and never cover Onboarding or Retention at all, even though that's usually where the most support tickets and the most churn risk show up.
- No Named Owner: Nobody is responsible for updating the map, so it reflects whichever team built it last and quietly goes stale everywhere else.
Tools for B2B Customer Journey Mapping
Tools for B2B customer journey mapping generally fall into two categories: visualization and collaboration platforms for building the map itself, and behavioral or analytics platforms for pulling the real interaction data the map depends on.
Neither category is required to get started, and a simple spreadsheet works fine for a first map. Dedicated tools become more useful once several people need to edit the same map, or once a map needs to sit next to real usage and support data automatically instead of being updated by hand.
Visualization and Collaboration Tools
These platforms are built for drawing, organizing, and sharing the map itself:
Tool |
Best For |
B2B-Specific Note |
|---|---|---|
Flexible whiteboarding for early drafts |
Good for quick, collaborative first passes |
|
Dedicated journey and persona mapping |
Lets you build a persona once and filter any map down to just that stakeholder's view |
|
Journey and persona mapping with templates |
Straightforward for teams new to formal journey mapping |
|
Journey management at scale |
Built for managing many journeys and teams in one workspace |
|
General diagramming |
Useful if your team already standardizes on it for other diagrams |
Behavioral and Analytics Platforms
These platforms pull the real interaction data a map depends on, rather than helping you draw the map itself:
Tool |
Best For |
B2B-Specific Note |
|---|---|---|
Product usage analytics |
Good for tracking in-product behavior once an account is live |
|
Cross-channel behavioral analytics |
Useful for large organizations already on the Adobe stack |
|
Account-based B2B revenue attribution |
Built specifically around long, multi-touch B2B buying journeys rather than single-session behavior |
|
CRM and marketing data in one place |
A practical starting point if your sales and marketing data already live there |
Smaply and Dreamdata are worth calling out specifically for B2B use. Smaply lets a team build a persona once and then filter any map down to a single stakeholder's path, a direct fit for a buying-committee-based map like the one this guide describes. Dreamdata, whose own positioning centers on the idea that most of a B2B buyer's journey happens before a salesperson ever gets involved, is built around account-level timelines instead of single-visitor sessions.
A few of these platforms, Amplitude among them, are starting to add AI-based predictive signals on top of the raw usage data instead of only reporting on what already happened. That's a useful supplement once a company is tracking many accounts at once, but it doesn't replace the role-by-role view a single Committee Handoff Grid gives for one account.
FAQs About B2B Customer Journey Mapping
-
How often should a B2B customer journey map be updated?
Most B2B teams should revisit their journey map every six to twelve months, or immediately after a major product, pricing, or org-chart change. A shorter review schedule makes sense right after you build the first version, since early maps often reveal holes in the data itself, not just the journey. Once the map stabilizes, tying reviews to a fixed point, such as the start of a renewal cycle, keeps it from quietly going stale between updates.
-
Does a small or mid-size B2B company need a customer journey map?
A journey map is useful for B2B companies of any size, though the shape of the committee is usually smaller. A 50-person company selling to other small businesses might have a two- or three-person buying committee instead of the five-plus roles common in enterprise deals, but the same handoff risks apply between sales, onboarding, and support. The return on mapping the journey often shows up faster at this size too, since a single account team can usually see and fix a problem without navigating layers of a larger company.
-
Who owns a B2B customer journey map after it's built?
No single department owns a B2B customer journey map by default, and that's usually the first problem to solve. Marketing typically has the best visibility into Awareness and Consideration, sales owns Decision, and customer success or support owns Onboarding and Retention, which means the map needs one named owner who pulls updates from all three groups rather than living inside just one of them. A map without a named owner tends to reflect whichever team built it last, and the stages that team doesn't touch are usually the first to go stale.
Some companies solve the ownership problem by handing the map to a Revenue Operations (RevOps) team instead of leaving it inside marketing, sales, or support alone, since RevOps already works across all three groups and has no single stage of its own to protect.
-
Can a B2B journey map be built without dedicated software?
Yes, a basic B2B customer journey map can be built with a spreadsheet, a shared slide deck, or even a whiteboard, especially for a first version scoped to one stage or one account. The stages, roles, and data sources matter far more than the tool, and a simple grid with stages as rows and buying-committee roles as columns, the same structure behind the Committee Handoff Grid described above, works without any specialized software. Dedicated tools like the ones covered in the Tools section become more useful once a company needs to maintain several maps at once, invite input from multiple teams, or export the map for stakeholders outside the account team.
Related Giva Resources
- How to Build a Customer Health Score Using Just Help Desk Data
- How to Tell If a Quiet Customer Account Is Satisfied or About to Churn
B2B Customer Journey Mapping Doesn't End at the Signature
Onboarding and Retention are where the real risk sits. The Committee Handoff Grid keeps earning its place there by checking, stage by stage and role by role, whether anyone is actually paying attention.
How Giva Fits Into Your B2B Customer Journey Map
A journey map only stays useful if the data behind it keeps up with the account. Most B2B teams can sketch the Awareness-to-Decision stages reasonably well from CRM and marketing data. The harder problem shows up right after the deal closes. The map is supposed to track onboarding, adoption, and renewal, but the interactions that actually reveal those stages, like a confused end user's first support ticket, three straight escalations from the same technical evaluator, or a budget signer who's gone quiet for two months, tend to live scattered across inboxes, spreadsheets, and whoever happened to take the call.
Giva's Customer Service Software closes that blind spot. Every call, chat, and email gets logged as a ticket tied to a contact, a resolution time, and a satisfaction score, exactly the kind of real interaction data a buying-committee-anchored map needs for its Onboarding and Retention stages. Instead of assuming a handoff problem exists between sales and support, teams using Giva can see it directly:
- A spike in reopened tickets from one stakeholder role
- A widening response-time gap on a specific account
- An early churn signal, well before a renewal conversation turns difficult
- A technical evaluator who's gone quiet since Decision closed, with no clear owner picking up where they left off
For B2B organizations where the buying committee includes an IT or technical evaluator who stays engaged long after signing, Giva's Help Desk Software extends that same visibility into day-to-day technical interactions, feeding the same account-level view a journey map depends on to stay current instead of becoming a diagram that gets built once and never revisited.
Get a demo to see Giva's solutions in action, or start your own free, 30-day trial today!



Categories: Help Desk, Customer Service