How to Build a Customer Health Score Using Just Help Desk Data
 By Ron Avignone
A support queue can flag a shaky customer account weeks before a renewal call goes sideways, if you know which patterns to watch. Reopened tickets, a rising escalation count, and a slower response time all say something about where an account is headed. Most support teams don't have a Customer Success platform sitting on top of billing and product-usage data to translate those signals into a number. What they have is a help desk, a queue of tickets, and a name for the account they're already a little worried about.
This article walks through how to build a complete customer health score using only help desk data. It covers the six ticket metrics that predict account risk and how to turn them into one weighted score. Just as important is the review schedule and follow-up actions that keep the score useful instead of accurate only once a quarter.

Key Takeaways
- A complete customer health score doesn't require a Customer Success platform: Six help desk metrics, weighted into a single 0-100 score, are enough to flag churn or renewal risk. No usage, billing, or engagement data is required.
- Six metrics drive the score: Contact rate trend, reopen rate, escalation rate, Service Level Agreement (SLA) miss rate, Customer Satisfaction (CSAT) trend, and response and resolution time trend.
- Rate matters more than raw count: Normalizing ticket volume by account size keeps large, active accounts from scoring as at-risk simply because they generate more tickets.
- Two moderate signals together outweigh one strong one: A rising reopen rate paired with a declining CSAT trend is a stronger warning than either metric moving alone.
- Every alert level needs a matching action: A Red-level (critical) score should trigger manager outreach within 48 hours, not just a flag on a dashboard.
What Is a Customer Health Score Built From Help Desk Data?
A customer health score built from help desk data is a single, weighted number, 0 to 100, that turns ticket activity into an early churn or renewal risk warning.
That's different from the fuller version used inside a dedicated Customer Success (CS) platform. That fuller version typically blends product usage, billing, and engagement data with support signals.
Giva's own Customer Satisfaction Metrics article lays out a four-part formula that combines Product Usage, a Support Interaction Score, Spending Level, and Engagement Level. This article takes that same Support Interaction Score component and builds it into a complete, standalone score for teams that don't have the other three inputs yet.
Help desk data in this context is whatever your ticketing system already records, from ticket status and reopens to SLA flags and post-resolution survey scores.
Why You Don't Need a Customer Success Platform to Start
Ticketing data alone is enough to build a genuinely useful customer health score, even though most Customer Success platforms treat support signals as a minor input rather than the whole model.
Giva's own four-part formula weights the Support Interaction Score at just 10% of the total, behind Product Usage, Spending, and Engagement. Outside models like Planhat's health-scoring guide (15% for support behavior) and Querri (25%) show the same pattern.
However, none of this means ticket data can't carry a full score on its own. These formulas are solving a different problem. They blend several systems most support teams don't have access to in the first place. When ticketing data is genuinely all a team has, weighting support signals at 100% of the score isn't a problem. It's simply the right amount of weight for the data that exists.
This kind of score can be built and kept current in a spreadsheet, with no integration, API connection, or new software purchase required, just a ticket export and a recalculation schedule. It goes one step further than even the lightweight, "no CS platform needed" scoring tools already on the market. It doesn't assume any CRM, usage, or billing data sitting underneath it.
And so, with that, everything from here on in this article assumes your ticketing system is the only account-level data you have.
The 6 Help Desk Signals That Feed a Ticket-Only Health Score
Six ticket metrics do most of the work of predicting account risk from help desk data alone:
-
Ticket Volume / Contact Rate Trend: The number of tickets an account opens, normalized against its own size or seat count rather than counted raw. Normalizing this way is what separates a large, healthy account from one that's genuinely generating more problems (more in Step 1 below).
Read this signal in both directions. A previously active account whose ticket volume drops toward zero isn't necessarily a success story. It can just as easily mean the account is going quiet before it leaves, a pattern sometimes called "silent churn."
- Reopen Rate: The share of an account's tickets that get reopened after being marked resolved. A rising reopen rate usually means the underlying problem wasn't actually fixed, not just that one agent made a mistake.
-
Escalation Rate: The share of tickets that require Tier-2, Tier-3, or management involvement instead of getting resolved at first contact, the inverse of First Contact Resolution (FCR). Escalations put an account's problems in front of people with less day-to-day context on that customer, which is itself a risk.
Some help desk reports combine this with reopen activity into a single escalation-and-reopen rate. Tracking them separately here makes it easier to tell a problem that simply needed more senior attention (an escalation) apart from one that wasn't actually fixed the first time (a reopen).
- SLA Miss Rate: The share of tickets that breach a first-response or resolution target. A single missed SLA rarely means much on its own, but a pattern of misses on one account signals a queue that isn't keeping pace with that customer's needs.
- CSAT Trend: The trailing 30 to 90 day average of post-ticket survey scores for an account. A single low score can be one bad interaction, while a declining trend across a quarter is a genuine signal.
- Response and Resolution Time Trend: How an account's average first-response time and resolution time are moving over recent periods, not just their absolute value. A team that resolves tickets slower for one account than for a comparable one is often already deprioritizing that relationship. Nobody may have intended that to happen.
A seventh signal sits outside these six metrics and doesn't require any scoring at all. It's a shift in tone across an account's tickets, from technical and neutral toward frustrated or blunt. You don't need Natural Language Processing (NLP) software to catch this. A support team lead who reads a handful of tickets from an at-risk account every few weeks will often notice the shift in wording first. It usually shows up before any of the six metrics above move. Treat this as a qualitative check alongside the score rather than a seventh number to calculate. It comes back as a tie-breaker in the Compounding Signals section below.
How to Build the Health Score: A Step-by-Step Model
Building a ticket-only customer health score means combining the six metrics above into a single 100-point composite score. The five steps below walk through normalizing the raw data, weighting each metric, and setting thresholds. From there, they run the math on a real account and turn the final number into an alert level with a matching action:
-
Step 1: Normalize Your Ticket Data by Account Size
Raw ticket count misleads the moment your accounts differ in size. A 200-seat account that opens 40 tickets a month and a 10-seat account that opens 8 tickets a month are not equally healthy. That's true even though the larger account's number looks worse on paper.
Contact rate fixes this by dividing ticket volume by a measure of account size, most often seat count, licensed user count, or account revenue. Tickets per seat per month is the simplest version, and it's the one most help desk platforms can already produce from existing reports.
Percentage-based metrics can skew at low ticket volume too. An account that only generates two or three tickets in a quarter can swing from a 0% to a 50% reopen rate on the strength of a single reopened ticket. That swing reflects a small sample more than it reflects account health. Below roughly five to ten tickets in a period, weigh the tone signal and raw counts more heavily than the calculated rate. Wait until enough tickets accumulate to make the percentage meaningful.
Where seat counts aren't reliable, compare an account's current volume against its own trailing 90-day average instead of against other accounts.
-
Step 2: Select Your Metrics and Assign Weights
Weights translate each metric into points on a 100-point scale. Over time, they should reflect which signals have actually predicted risk in your own account base.
Which metric should carry the most weight? The ones that reflect how a customer currently feels, such as CSAT trend, tend to predict risk earlier than ones that mostly reflect volume. Until you have enough history to test that against your own accounts, the following weighting is a reasonable starting point:
- CSAT Trend, 25 points: It's the most direct read you have on how the account currently feels about your service. That's why it carries the largest single weight.
- SLA Miss Rate, 20 points: A pattern of missed commitments erodes trust fast, especially close to a renewal date.
- Reopen Rate, 15 points: Reopens signal problems that aren't actually being solved, not just problems being logged.
- Escalation Rate, 15 points: Escalations concentrate risk with less context, and they cost the account more effort per issue.
- Response and Resolution Time Trend, 15 points: A slowing trend often shows up before a customer complains about it directly.
- Ticket Contact Rate Trend, 10 points: Volume matters, but it's the weakest standalone predictor of the six. Some healthy accounts are simply more active than others.
Treat these numbers as a calibration starting point. Once you've run the score for two or three quarters, adjust the weights toward whichever metrics actually preceded your real churn and renewal-risk cases.
-
Step 3: Set Point Thresholds for Each Metric
Each metric needs threshold markers that convert a raw number into points earned out of its total.
There's no industry-standard threshold for what counts as a bad reopen rate or an acceptable SLA miss rate. It depends on your product's complexity, your team's staffing, and what "normal" has looked like for that specific account. Treat any published number here, including the ones below, as a rough starting point rather than a benchmark to hit. For example:
- CSAT Trend: Use full points if the trailing 90-day average is flat or rising; roughly half points for a 5 to 10% decline; minimal points for a decline greater than 10%.
- Reopen Rate: Use full points if below roughly 5%; partial points in the 5 to 10% range; minimal points above 10%.
- SLA Miss Rate: Use full points at zero misses in the period; partial points for occasional misses; minimal points once misses become a recurring pattern rather than a one-off.
Some teams build this same idea a different way. Instead of trailing-average ranges, they set a fixed number of points for each individual escalated or reopened ticket and add points back for a stretch of strong CSAT responses. That event-based version is faster to set up, but it reacts to single tickets rather than a trend. That makes it more sensitive to the low-volume skewing described in Step 1.
-
Step 4: Calculate the Composite Score With a Worked Example
The clearest way to see how the weights and thresholds above come together is to run them against one account. We'll use a fictional mid-size manufacturing client called Meridian Robotics.
Here's how Meridian's quarter actually breaks down, metric by metric:
Metric
Max Points
Meridian Robotics Score
What Happened
CSAT Trend
25
10
Trending down over the quarter
SLA Miss Rate
20
12
A handful of misses, not a pattern yet
Reopen Rate
15
7
Elevated compared to baseline
Escalation Rate
15
13
Close to normal
Response/Resolution Time Trend
15
9
Drifting up modestly
Contact Rate Trend
10
10
Flat against its own baseline
Meridian Robotics totals 61 out of 100. That score puts the account in the Yellow level defined in Step 5 below. That level means the account goes on the weekly at-risk review list, not on an emergency call list, and not left ignored until the next quarterly check-in.
And here's what a tracking spreadsheet might look like:
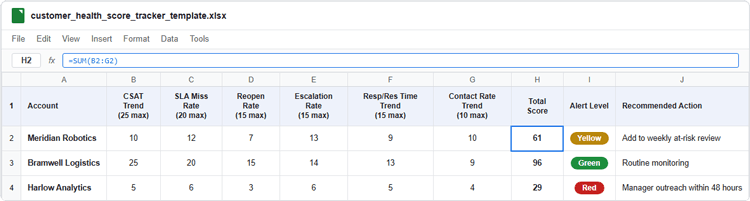
Customer Health Score Help Desk Data Tracking Spreadsheet Example
-
Step 5: Define Alert Levels and Tie Each to an Action
A score only earns its keep once it triggers something. The three alert levels below are a version of the RAG — Red, Amber (Yellow), Green — status system used across project and KPI reporting. They give Meridian Robotics's 61, and every other account's score, a clear next step instead of just a number on a dashboard.
Alert Level
Score Range
What It Means
Recommended Action
Green
71-100
Stable account, no signals trending in a concerning direction
Routine monitoring; no separate outreach beyond normal account management
Yellow
41-70
One or more metrics have moved in the wrong direction, but nothing has failed outright
Add to the weekly at-risk review; watch for a second signal moving before escalating further
Red
0-40
Multiple metrics have deteriorated together, or one has failed badly
Manager outreach within 48 hours
Like the thresholds in Step 3, treat these ranges as a starting point. Recalibrate them once you can see which score ranges actually preceded a real cancellation or a rocky renewal in your own accounts.
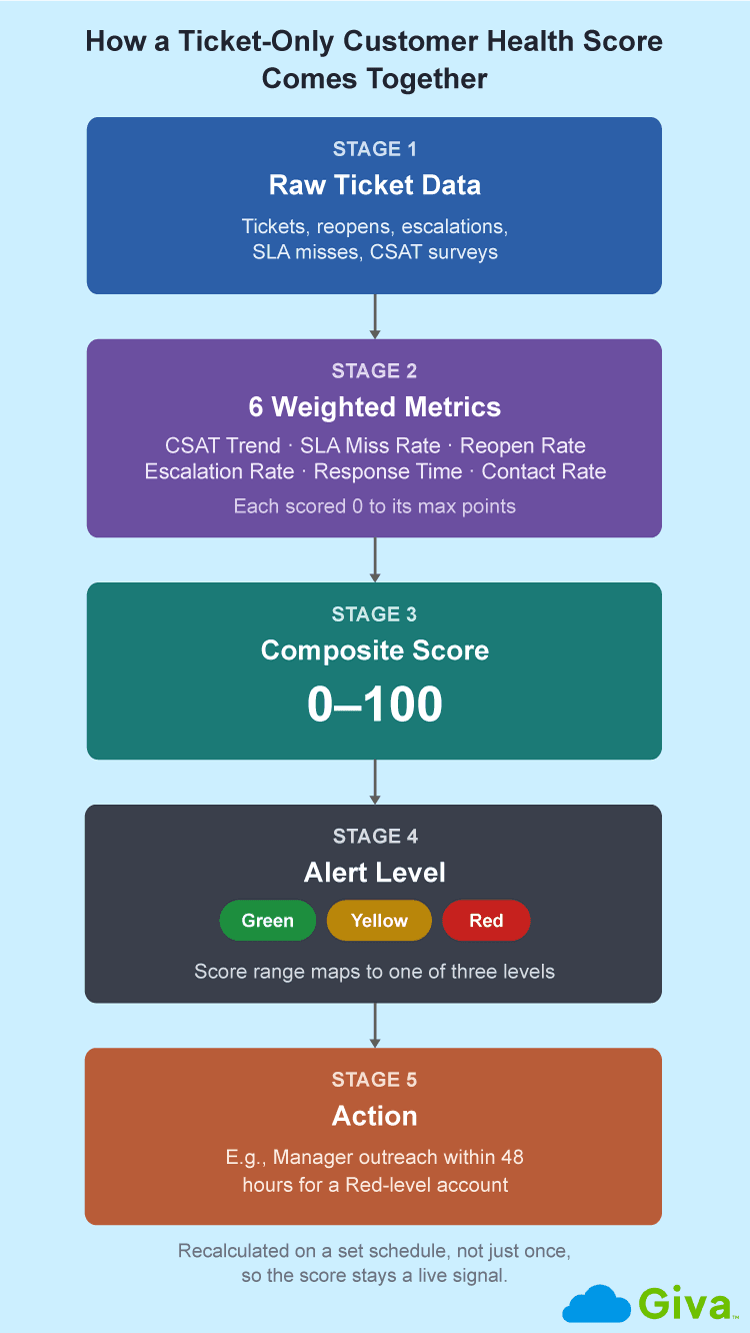
How a Ticket-Only Customer Health Score Comes Together
Reading the Score in Context: Compounding Signals Over Single Triggers
Two moderate warning signs moving together are usually a stronger signal of account risk than any single metric spiking on its own.
So which combination should you actually worry about? A reopen rate that climbs from 4% to 9% in isolation might just mean one complicated issue took two tries to fix. The same climb alongside a CSAT trend that's dropped 8 points over the same quarter tells a different story. The account isn't just hitting a hard problem. It's losing patience with how that problem is being handled.
This is where the tone and sentiment signal from the "Help Desk Signals" section above earns its place. When two moderate metrics are trending the same direction and a support lead also notices ticket language turning terser or more frustrated, treat that combination as a real warning. It counts even if the composite score still sits in the Yellow range.
A single SLA miss during an outage that affected dozens of accounts isn't the same signal as a miss that's specific to one account with no external cause. Read every metric against what else was happening in the same period. Don't treat a one-time spike as a trend.
How Often to Recalculate the Health Score
Recalculate the score weekly for accounts already flagged as at-risk, and monthly across the full account portfolio. Recalculate it quarterly too, whenever you're reviewing or adjusting the weights and thresholds themselves.
A single fixed review schedule for every account doesn't fit how risk actually moves. A stable, Green-level account doesn't need a fresh score every week, and running one wastes review time that's better spent on accounts actually showing movement.
An account already at the Red level can't wait a month for its next check either. The 48-hour outreach window from Step 5 only works if someone is actually watching for changes at that speed.
Planhat's health-scoring guide above argues that manual scoring can't keep up. It goes as far as to say a health score three weeks old "is not a health score" but "a history report." That's a fair criticism for a score that nobody revisits. It's not a fair criticism, though, of the review schedule described here. Even an at-risk account gets a fresh look every week.
Customer Health Score vs. CSAT vs. NPS
A customer health score, CSAT, and Net Promoter Score (NPS) measure different things at different points in the customer relationship. None of the three substitutes for the other two.
CSAT measures a single interaction, capturing how the customer felt about one ticket, call, or resolution.
Net Promoter Score (NPS) measures the broader relationship, capturing how likely a customer is to recommend you at a given point in time, regardless of any one interaction. Promoters and Detractors differ meaningfully in long-term value to the business. That's one reason a relationship-level score like NPS still matters even when a ticket-level health score looks fine.
A customer health score sits above both, combining ticket-level and relationship-level signals into one composite view of account risk over time.
Customer Health Score vs. CSAT vs. NPS Quick Review
Metric |
What It Measures |
Time Horizon |
Best Used For |
|---|---|---|---|
CSAT |
A single interaction or ticket |
Immediate, per-interaction |
Catching agent-level or issue-level problems right after they happen |
NPS |
The overall customer relationship |
Periodic (quarterly or biannual surveys) |
Gauging loyalty and referral likelihood across the account |
Customer Health Score |
Ticket-level signals across an account over time |
Continuous, recalculated on a set schedule |
Predicting churn or renewal risk before it shows up in a survey or a cancellation |
Common Mistakes When Building a Ticket-Only Health Score
Most ticket-only health score efforts fail for one of a handful of avoidable reasons, not because the underlying method is flawed.
What actually separates a score that stays useful from one that quietly stops mattering within a quarter? Usually, it's one of the following seven mistakes:
- Scoring on raw ticket count instead of a rate: Comparing raw ticket totals across accounts of different sizes punishes your largest, healthiest customers. They simply generate more tickets in absolute terms.
- Reacting to a single metric spike: One bad month on one metric is noise more often than it's a trend. That's especially true without checking whether something else, like an outage, explains it.
- Copying someone else's thresholds: A reopen rate or SLA miss rate that signals danger for one company's product and support model may be completely normal for another's.
- Letting the score go stale: A score that's three months old describes where an account used to be, not where it is now.
- Defining alert levels without a concrete action attached: An alert level that doesn't trigger a specific next step is just a label, not a working part of the model.
- Comparing raw scores across account segments without normalizing for size first: A 40-seat account and a 400-seat account need their own baselines first. Only then do their scores mean anything next to each other.
- Assuming fewer tickets always means a healthier account: A sharp, unexplained drop in ticket volume can look like good news on a dashboard. For a previously active account, it can instead mean the customer has quietly disengaged rather than gotten healthier. Treat a sudden quiet queue as a prompt for a check-in call, not an automatic win, especially close to a renewal date. Learn more from our article on How to Tell If a Quiet Customer Account Is Satisfied or About to Churn.
Customer Health Score FAQs for Help Desk Teams
-
What is a churn risk score, and how is it different from a customer health score?
A churn risk score is a narrower, single-purpose probability estimate that a specific account will cancel or not renew. A customer health score is a broader, multi-metric view of account well-being, with a churn probability as one possible output.
Churn risk models are often built with statistical or machine learning methods trained on historical cancellation data, producing a single percentage likelihood. A customer health score, by contrast, is usually built from several observable metrics like the ones in this article. It's meant to explain why an account looks at-risk, not just estimate the odds that it will leave.
-
Can you build a customer health score in a spreadsheet using only help desk data?
Yes, every metric behind a ticket-only customer health score comes from a standard help desk report or export. A spreadsheet is enough to build and maintain the score without new software.
Most ticketing platforms can already export ticket-level data with account, status, timestamp, and survey fields attached. Pulling that export on the review schedule described above is all it takes to run the model in this article.
-
Do you need a CRM to build a customer health score this way?
No, a CRM isn't required to build a ticket-only customer health score, since every input comes from help desk data you already have.
A CRM becomes useful once you want to fold in billing, contract, or renewal-date data alongside your support signals. That combination is a different, fuller version of a health score, covered in the Support Interaction Score discussion above. Until then, the ticket-only version in this article works entirely on its own.
-
What tools can calculate the fuller, CS-platform customer health score automatically?
Dedicated Customer Success platforms such as Gainsight, ChurnZero, and Totango can calculate the fuller, CS-platform customer health score automatically by blending ticket, product-usage, and billing data. That's an automated alternative to the manual, spreadsheet-based, ticket-only model in this article.
These platforms typically require product-usage, billing, or CRM integrations that many teams simply don't have in place. Closing that gap without new software is exactly what the model in this article does.
Related Giva Resources
- 20 Top Strategies for Proactive Customer Service Plus Examples
- Customer Service Levels: Definition, The 5 Levels, and 20 Creative Improvement Strategies
- B2B Customer Experience Strategy: How to Design, Measure, and Scale Account-Level CX
Turning Help Desk Data Into a Customer Health Score That Holds Up
The model in this article takes the Support Interaction Score component of a bigger formula and builds it into something complete on its own. It runs on six metrics, defined weights, and alert levels that map to real actions.
Catching risk this early protects more than the current renewal. It protects the account's full Customer Lifetime Value (CLV), the total revenue that account would have generated across every future renewal if the relationship had held.
Your team may eventually gain access to product usage, billing, or engagement data, and when that happens, the same structure extends into the fuller four-part Customer Health Score formula covered above. Those new inputs add on top of the ticketing signals instead of replacing them.
A score reviewed on a set schedule and tied to a specific action for each level stays useful for as long as you keep running it. One that sits static in a spreadsheet, recalculated once and then forgotten, stops being a health score. It becomes the "history report" described earlier, not a working signal.
Turn Help Desk Data Into an Early-Warning System With Giva
A ticket-only health score is only as good as the data feeding it. That starts with a ticketing system that makes reopen rates, escalation rates, SLA status, CSAT, and response times easy to pull by account, not buried across a dozen disconnected reports. If building that reporting layer by hand is the hardest part of putting this model into practice, the right software removes that friction entirely.
Giva's Customer Service Software gives customer-facing teams a single system of record for every ticket, SLA, and satisfaction survey an account generates. The metrics behind a health score are already there when you need them, with no separate analytics pipeline required. For teams whose help desk data spans internal IT as well as external accounts, Giva's Help Desk Software runs on the same underlying reporting engine. The same scoring model works whichever side of the desk your accounts sit on.
You might be standing up your first ticket-only health score, or extending it later with usage or billing data into the fuller Customer Health Score formula. Either way, the goal stays the same. Catch account risk from the data you already have, before it turns into a churned renewal.
Get a demo to see Giva's solutions in action, or start your own free, 30-day trial today!



Categories: Help Desk, Customer Service