What's a Reasonable Number of Tickets Per Day for an IT Support Analyst?
A manager pulls up last week's dashboard and sees one analyst closed 22 tickets a day and another closed 48. Is the first one slacking, or is the second one burning out on volume that isn't sustainable? The question comes up so often, in help desk forums, career subreddits, and one-on-ones with a new hire, that it's worth asking directly: what actually counts as a reasonable ticket load?
In our article below, we cover what the available benchmarks actually say (and where they fall apart), why tier, channel, and ticket complexity change the math more than any single number can capture, and a framework for building a ticket target that's fair to your specific team instead of borrowed from a survey of unrelated companies.

Key Takeaways
- There's no single "right" number: Any broad industry benchmark blends together different tiers, channels, and company sizes into one figure, so your own mix will always push the real number above or below whatever's commonly quoted.
- Raw ticket count is a weak performance signal: A wide spread in daily counts across a team usually points to uneven workload distribution, not a gap in effort or skill.
- Utilization, not ticket count, predicts burnout: Per MetricNet's research, once agent utilization climbs into the 60 to 70 percent range, turnover and burnout risk rise, largely independent of the raw number of tickets behind it.
- A fair number has to be built, not borrowed: The Controllable Ticket Load framework gives you a repeatable way to reason about your own team's number instead of importing someone else's average.
Can There Be a Definitive Benchmark for Daily Tickets Per Analyst?
It's commonly stated that most IT support analysts handle somewhere between 25 and 35 tickets a day. To see how much that range can actually move, we checked it against real ticket data from one of our own high-traffic IT help desk customers. Depending on exactly how you draw the line around "who's on the help desk," the average came out anywhere from about 1.4 to 7.25 tickets a day per agent, nowhere near that commonly cited 25 to 35.
Counting every ticket across the entire IT service desk, every team, every assignee, the number was 1.4 a day. Counting only tickets that came through the default help desk queue, regardless of who on the broader IT staff actually worked them, it rose to 5.3. And counting only the people who belong to the help desk team itself, no matter which queue their tickets came from, it climbed to 7.25.
This is one company's ticket data, from one year, sliced three different ways. The definition alone moved the number by more than 5x. None of those three numbers is "the real one," and none of them is close to the commonly cited range either.
And that's the actual point. The right number for any one agent depends on support tier, channel, and how complex those tickets are, and how you define "agent" and "ticket" changes the answer just as much, even inside a single organization with the underlying data sitting right there to check. No outside benchmark, however commonly cited, can make that decision for you. It has to come from your own data and your own definitions, which is exactly what the Controllable Ticket Load framework in this guide is for.
Why the Number Changes by Support Tier
Tier 1 agents spend most of their day on routine, scripted work, password resets, account access, and issues with a documented fix, so they typically handle more tickets per day than Tier 2 or Tier 3, who spend longer on each ticket because the underlying problem takes more digging to solve.
For a full picture of how work moves between tiers, see our article on the 5 tiers of IT support. It breaks down what each level actually handles, from Tier 0 self-service through Tier 4 vendor escalations. Generally though, here are the types of issues and ticket loads the main working tiers handle:
- Tier 1: Routine, high-repetition tickets with a documented fix, typically the highest volume per agent
- Tier 2: More complex troubleshooting that takes longer to diagnose, typically fewer tickets per agent
- Tier 3: Specialized or heavily escalated issues that can run for days, typically the smallest slice of daily volume
Support Tier |
Typical Ticket Type |
Relative Daily Volume |
|---|---|---|
Tier 1 |
Routine, scripted issues (password resets, account access) |
Highest |
Tier 2 |
Multi-step troubleshooting requiring more diagnosis |
Lower |
Tier 3 |
Specialized, escalated, or multi-day issues |
Lowest |
What doesn't hold up under scrutiny is any specific claim about exactly what share of total ticket volume each tier handles. That ratio swings enormously between organizations, even within similar-looking IT shops, so treat any number you see quoted for this as a rough guess rather than an industry constant.
Why Channel Type Changes the Math
Phone and live chat require an agent's full, synchronous attention for the length of the interaction, which naturally caps how many an agent can close in a day. Email and portal tickets are asynchronous, so an agent can work several at once between responses, which is part of why a purely email-based queue tends to support a higher daily count than a phone-heavy one.
Average Handle Time (AHT) is the companion metric that explains this gap in more detail. See our article on average handle time, how it's calculated and what drives it up or down by channel, for a deeper look.
Why Other Duties Change the Math
Ticket count also depends on how much of an agent's day is actually available for tickets in the first place. An agent who spends part of their shift on desk-side visits, walk-up support, or routine system maintenance has less time left to close tickets than one working a pure queue, even if both are equally skilled and equally busy.
This is easy to miss when comparing counts across a team. Two agents on paper doing the "same job" can have very different realistic ticket capacities once you account for how much of their day the ticket queue actually gets.
Why Raw Ticket Counts Are a Poor Way to Judge Workload
A flat ticket count treats a password reset and a multi-system outage as the same unit of work, and they aren't. So if two agents both close 30 tickets in a day, are they actually doing the same amount of work? Usually not, and that gap is exactly why quality metrics get more weight than volume in most serious performance conversations.
First Contact Resolution (FCR), Customer Satisfaction Score (CSAT), and Service Level Agreement (SLA) compliance all say more about whether a help desk is actually working than a raw daily count does. A team hitting its ticket target while FCR and CSAT both slide is trading quality for a number.
Raw counts hide a second problem too: not every ticket is the same size of work. A password reset takes two minutes; a multi-system outage can take hours, and treating them as the same unit on a spreadsheet erases that difference entirely. Giva's guide to incident vs. service request classification digs into that same distinction in more depth.
The practical fix is assigning tickets by workload and complexity rather than spreading them evenly by count. Some help desk platforms support load-based routing, which checks what an agent is already carrying before handing them another ticket, instead of round-robin assignment, which hands out the next ticket regardless of how complex the agent's existing queue already is. A few teams add workload caps or a short cooldown period after a complex ticket closes, specifically so one agent doesn't get stacked with back-to-back escalations while another coasts through the day with only easy resets.
Here's the honest limit of all this: there's no universal formula for weighting ticket complexity the way there's a raw ticket-count benchmark. What counts as "complex" depends entirely on your own ticket mix, your tools, and your team's experience level, so this is something every team has to determine for itself rather than using a published benchmark.
The Controllable Ticket Load Framework: A Fairer Way to Talk About Workload
Controllable Ticket Load splits an agent's queue into three categories: Carried, Active, and Blocked. This is so a manager and an agent can talk about workload using the same specific language instead of arguing over one number that hides all the context.
Two agents can carry the exact same ticket count and still be doing very different amounts of real work. One agent's 30 tickets might be almost entirely within their control to move forward today. Another agent's 30 might include a dozen sitting in a vendor's queue, waiting on hardware, or stuck behind another team's change window. Same count, completely different day.
-
Carried Load
Carried load is every ticket currently assigned to the agent, full stop. It's also what most raw "tickets per day" benchmarks are actually measuring, which is exactly why those benchmarks are the least useful number on their own. A high Carried load could mean an overloaded agent, or it could mean an agent with a queue full of tickets they're simply waiting on.
-
Active (Controllable) Load
Active load is the subset of Carried tickets the agent can genuinely move forward today, the ones where they can take the next step. This is the number that actually predicts whether someone is overloaded, because it reflects real, in-their-hands work rather than everything sitting in their name.
-
Blocked Load
Blocked load is everything Carried but genuinely stalled on something outside the agent's control:
- A vendor shipment
- A hardware order
- Another team's change window
- A ticket escalated to a higher tier and now sitting in someone else's queue
- An end user who hasn't responded yet
A high Carried load that's mostly Blocked is not the same problem as a high Carried load that's mostly Active, and treating them the same is how managers end up misjudging both agents.
Category |
What It Means |
What It Signals |
|---|---|---|
Carried Load |
Every ticket currently assigned to the agent |
The number raw benchmarks measure; least useful alone |
Active (Controllable) Load |
Tickets the agent can move forward today |
The real workload driver and overload signal |
Blocked Load |
Tickets stalled on something outside the agent's control |
Explains why Carried load can be misleading |
Picture two agents on the same team. The first is Carrying 32 tickets, but only 21 are Active and controllable, the other 11 are sitting with a vendor or another team (Blocked). The second is Carrying 24 tickets, and nearly all of them are Active. On a raw count, the first agent looks like they're carrying more work. In reality, their controllable load is lower than the second agent's, and a manager comparing the two on ticket count alone would get it backward.
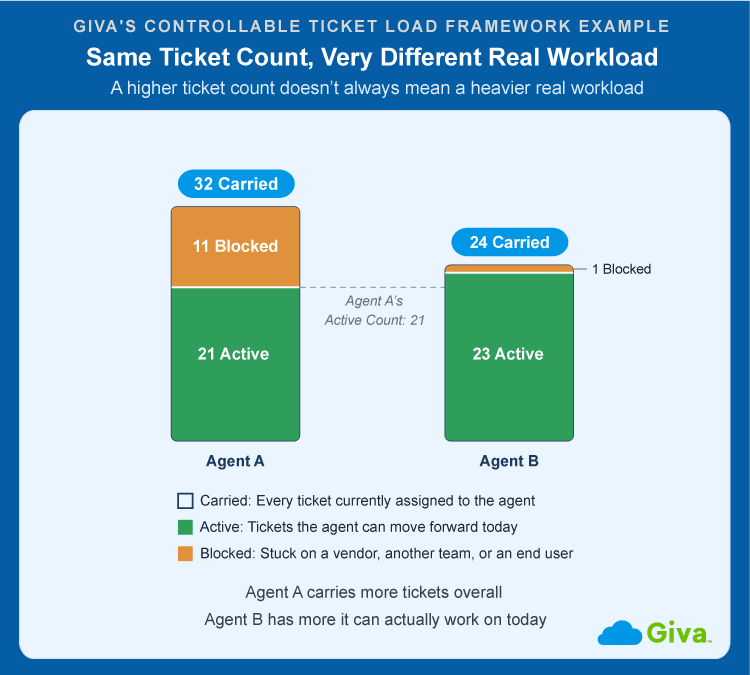
Help Desk Ticket Workload: Carried Active Blocked Example
Same caveat as the complexity-weighting problem above: there's no real "healthy" Active-to-Blocked ratio that can be benchmarked. Your own mix is the only baseline worth measuring against.
The point of naming these three categories isn't to produce a new number to chase. It's to give agents and managers a shared, specific vocabulary for the workload conversation itself, instead of a debate over one contested count that neither side can fully defend.
The Real Burnout Lever Is Utilization Rate, Not Ticket Count
Besides the metrics covered above, burnout is another important reason to understand these ticket-measurement differences. The real driver is agent utilization, the percentage of an agent's working time spent actively on tickets, as opposed to meetings, training, or other duties, not the raw ticket count.
MetricNet, an independent IT benchmarking firm, found that once utilization climbs into the 60 to 70 percent range, service desks start seeing noticeably higher turnover because agents are being pushed too hard, and pushing utilization even higher brings burnout, absenteeism, and lower morale into the mix as well.
What actually predicts burnout then, the ticket count or something else? The research points squarely at utilization. An agent working a synchronous, phone-heavy queue at 70 percent utilization is under real pressure even if their raw ticket count looks modest next to a colleague working async email tickets at the same utilization level.
Utilization is easy to confuse with the related metric "occupancy," and the difference matters here. Occupancy only counts the time an agent is logged in and actively working tickets, while utilization measures productive time against the agent's entire paid shift, training, meetings, and admin work included. Giva's deeper look at occupancy in the call center walks through why the two can tell very different stories: an agent can show moderate utilization for the day while their occupancy during actual logged-in hours is close to maxed out, which is often the sharper early warning sign of burnout.
The stakes are real. HDI has found that average annual agent turnover across technical support and service desks runs to nearly 40 percent, meaning the typical agent stays only about two and a half years. That's an expensive number to move in the wrong direction by quietly running a team over capacity.
How Managers Can Calculate a Fair Ticket Target for Their Team
Individual fairness only gets you so far if the team as a whole is understaffed. Managers need a way to translate ticket volume into a defensible headcount number, not just a gut feeling about who seems busy.
The calculation itself is straightforward once you have two inputs: your monthly ticket volume and your average handle time per ticket.
- Step 1: Total Hours Worked = Tickets x (Average Handle Time in minutes / 60)
- Step 2: Required Full-Time Equivalent (FTE) = Total Hours Worked / (Available Working Hours per FTE x Utilization Rate)
Here's a working example: 400 tickets a month at 30 minutes of average handle time comes to 200 total hours worked. On the other side, a full-time agent has roughly 160 working hours in a typical month (40 hours a week x 4 weeks). Apply a reasonable utilization rate, say 75%, and that agent has about 120 hours actually available for ticket work (160 x 0.75). Divide the 200 hours of work by that 120-hour capacity, and you land at about 1.67 FTE needed to cover that volume, meaning the workload realistically calls for close to two full-time agents, not one. Substitute your own ticket count, handle time, and utilization target, and the arithmetic stays the same.
Skip the temptation to reach for a fixed user-to-technician ratio as a shortcut. MetricNet has specifically called out fixed staffing ratios as a common misperception, arguing that staffing should scale with actual ticket volume and complexity rather than a flat number of users per technician. A 1:80 ratio might be plenty for a simple, single-system environment and badly understaffed for a technical, high-ticket-complexity one.
Getting this calculation wrong is not just an agent-experience problem. HDI's own service desk benchmarking found the cost of a resolved ticket can vary by more than 100X between the cheapest self-service resolution and the most expensive walk-up ticket, so a staffing miscalculation compounds across thousands of tickets a year, not just one overloaded queue.
Now, here's where the Controllable Ticket Load framework above and calculating a fair ticket target meet. A staffing number built only from raw ticket counts will overstate a team's real capacity if a large share of the queue is Blocked rather than Active. Run the fair-ticket target formula above against Active, controllable load rather than total Carried load, and the resulting number holds up a lot better under real conditions. Note that, when a team is genuinely understaffed for the volume it's handling, a growing backlog is usually the first visible symptom, well before anyone runs the FTE math to confirm it.
How AI Is Changing the Ticket Volume Conversation
AI-assisted triage and self-service tools are increasingly absorbing the most repetitive, documented-fix requests, the same Tier 1 tickets that make up the bulk of most benchmark figures before they ever go to a human agent's queue.
The precise scale of that shift is genuinely hard to pin down. Publications often quote specific deflection rates (the percentage of tickets AI or self-service resolves before a human agent ever sees them) and cost-per-resolution figures, but the sourcing behind most of those numbers doesn't hold up to a direct check. But what's clear is that as AI absorbs more of the simplest, highest-volume requests, the tickets that do reach human agents skew toward higher complexity, and raw ticket counts for those agents should trend down over time even as the work itself gets harder, not easier. And that's another reason to lean on the Controllable Ticket Load framework rather than a fixed benchmark number.
5 Common Mistakes When Setting Ticket Volume Targets
- Importing an unrelated benchmark: Pulling a number from a different industry, team size, or channel mix and applying it without adjusting for how different your own environment actually is.
- Comparing raw counts across tiers: Stacking one agent's count against another's without accounting for tier or complexity, which is how a senior agent handling hard escalations ends up looking "less productive" than a junior agent on easy resets.
- Ignoring Blocked tickets: Judging an agent's Carried load as if every ticket in it is equally within their control, when a chunk of it may genuinely be stuck waiting on a vendor or another team.
- Chasing volume alone: Treating ticket count as the only signal that matters instead of pairing it with FCR, CSAT, and SLA compliance.
- Rewarding speed without checking quality: Praising unusually fast resolution times without also checking reopen rates, since a suspiciously quick close is sometimes a rushed, low-quality one rather than genuine efficiency.
FAQs About Reasonable Help Desk Ticket Volume
-
How many tickets a day is normal for a Tier 1 help desk agent?
There's no single verified industry figure specific to Tier 1 alone. That's consistent with this guide's larger point: a blended industry average wouldn't tell you much even if one existed. What's reliably true is that Tier 1 agents handle simpler, more scripted requests than Tier 2 or Tier 3, so they typically move through more tickets in a day, just not by any fixed, universal amount. The real number for your team comes from your own ticket mix and channel, not a borrowed one.
-
Is ticket volume a good way to measure help desk performance?
Not on its own. Ticket count says nothing about whether the work was done well, so it needs to be paired with FCR, CSAT, and SLA compliance to mean anything. A team can hit its volume target while quality quietly slips, which is a worse outcome than missing the number in the first place.
-
How many tickets should a new IT support analyst handle in their first month?
Fewer than the team's standard target, on purpose. New analysts should ramp into a full ticket load gradually rather than start at a full target on day one, since they're still learning escalation paths, internal tools, and the team's knowledge base.
Our article on onboarding new IT help desk analysts lays out a week-by-week ramp structure if you're building this out formally.
-
What's a healthy help desk ticket backlog?
A healthy backlog is measured by ticket age, not a fixed percentage of daily volume.
HDI's benchmarking research found that top-performing service desks keep almost no tickets open past 30 days, and very few past 10. If your backlog is climbing past those age thresholds rather than clearing out, that's a capacity or process problem worth investigating, not just normal variation.
-
Does AI reduce how many tickets an IT support agent has to handle?
For the simplest, most repetitive requests, yes. AI-assisted triage and self-service tools are increasingly absorbing routine, documented-fix tickets before they reach a human agent. The tickets that still land in an agent's queue tend to skew toward higher complexity as a result, so total ticket count can drop even as the average difficulty of each remaining ticket goes up.
-
How do I talk to my manager about an unfair ticket load?
Bring a breakdown, not just a feeling of being overwhelmed. A vague "I have too many tickets" is easy for a manager to dismiss, but a specific Carried-versus-Active-versus-Blocked breakdown of your own queue is much harder to wave away. Walk in with your actual numbers: how many tickets you're Carrying, how many you can genuinely move forward today, and how many are stuck waiting on someone else.
Frame it as a request to prioritize together rather than a complaint. Managers generally respond better to "here's what my queue actually looks like, help me figure out what to tackle first" than to an open-ended statement that something feels unfair. If the Blocked share of your queue is large, that's also worth naming directly, since it may point to a process problem elsewhere, not a workload problem you can fix on your own.
Related Giva Resources
- 7 IT Help Desk Reports Every Manager Should Review Weekly
- Preventing Help Desk and Call Center Burnout: Ideas for Managers and Agents
- SLA Breach Root Cause Analysis: How to Find What's Causing Your Help Desk Ticketing Breaches
- 35 Unique Help Desk Metrics for the Best Agent Performance
Building a Ticket Volume Target That's Actually Fair to Your Team
As covered above, any broad industry benchmark only means anything once tier, channel, and ticket complexity have adjusted it for your specific environment.
The more useful shift is moving away from a single contested count and toward the questions that actually predict whether a workload is fair: how much of what an agent is Carrying is genuinely Active and controllable, and how close is utilization creeping toward the range where burnout and turnover start to climb? Those two questions will tell you more about your team's real capacity than any borrowed benchmark ever could.
See Your Team's Real Workload with Giva
A "reasonable" ticket count only means something if you can actually see what your team is Carrying, and whether that load is genuinely Active or quietly stuck waiting on someone else. Most help desks can tell you a raw ticket count in seconds. Far fewer can tell you, right now, how much of that count is truly controllable.
Giva's Help Desk Software gives managers that visibility directly, with productivity reports and custom dashboards that show what's actually happening across the team, plus AI Copilots that help agents move faster through their Active tickets: a Knowledge Copilot that finds the right answer from your own knowledge base, and a Ticket Copilot that summarizes each ticket and suggests next steps. That's what turns a benchmark number into an actual, fair target for your specific team.
If you're not sure whether your team's ticket load is reasonable or just quietly unmanageable, the fastest way to find out is to actually see the breakdown, not guess at it from a raw count.
Get a demo to see Giva's solutions in action, or start your own free, 30-day trial today!



Categories: IT, Help Desk