Customer Experience Journey Mapping: 5 Types, 8 Steps, and How to Drive Real Change
 By Ron Avignone
Your team answered the ticket in under two hours. The customer satisfaction score came back a five out of five. Three weeks later, the customer switched to a competitor.
What went wrong? In most cases, it wasn't the ticket. It was the four touchpoints before it. The confusing onboarding email. The help article that buried the answer three pages deep. The renewal notice that felt like a surprise. The ticket was fine. The journey wasn't. This guide covers customer experience journey mapping from the ground up, including how to choose the right type of map, how to build one step by step, and what it takes to turn findings into actual improvements.

Key Takeaways
- What it is: Customer experience journey mapping is the process of creating a visual representation of every step a customer takes with a company, capturing their actions, emotions, and pain points at each stage to identify where the experience can be improved.
- Five map types: Current state, future state, day-in-the-life, service blueprint, and buyer's journey maps each serve a distinct purpose. Choosing the wrong type for your goal is one of the most common early mistakes.
- The map-to-action gap: Research consistently shows that most journey maps never drive organizational change. The diagram itself has no value unless someone owns the follow-through.
- Proven ROI: Journey-level CX programs consistently outperform touchpoint-level programs across satisfaction, revenue, and customer retention. The returns come from addressing how the full experience connects, not from improving individual interactions.
- Measurement: Net Promoter Score (NPS) tracks relationship-level loyalty. Customer Satisfaction Score (CSAT) measures touchpoint satisfaction. Customer Effort Score (CES) captures friction at specific interactions. Each belongs at a different stage of the journey.
What Is Customer Experience Journey Mapping?
Customer Experience (CX) journey mapping is the process of creating a visual representation of every step a customer takes with a company, capturing their actions, emotions, and pain points at each stage to identify where the experience can be improved.
The output is a shared document that makes the customer's perspective visible to everyone involved in delivering the experience, from marketing to product to support. Most organizations already have data about what customers do. Journey mapping fills in what most data misses, capturing how customers feel at each step and what they expected going in. The resulting visual storyline of the customer relationship makes abstract experience patterns understandable to everyone who shapes or depends on it.
Key Components of a Customer Journey Map
A complete customer journey map includes five elements:
- Actor: The customer persona whose journey is being mapped. Journey maps are always tied to a specific type of customer, not a generalized "user."
- Scenario and Expectations: The specific situation and goal the actor is trying to achieve, plus what they expect going in. A support journey and an onboarding journey are different scenarios and need separate maps.
- Journey Phases: The high-level stages the customer moves through, typically awareness, consideration, purchase, retention, and loyalty. The exact phases vary by business model and map purpose.
- Actions, Mindsets, and Emotions: What the customer does, thinks, and feels at each phase. The emotional layer is often the most revealing part of the map.
- Opportunities: Where the map reveals gaps between customer expectations and the actual experience. These are the actionable outputs of the exercise.
Customer Journey Map vs. Customer Experience Map
A customer journey map tracks a specific persona through a specific scenario with a specific product or service. It's focused and tied to a defined goal. A customer experience map is broader, capturing the overall relationship between a customer and a brand across many contexts, without being anchored to one particular scenario.
A journey map asks a focused question about what a specific customer type experiences when trying to accomplish a specific goal. A customer experience map asks something wider about how the brand feels across all interactions and all customer types. Both are useful, but for different purposes.
Other Customer Journey Mapping Tools
- Service Blueprints extend the journey map by adding a view of the internal processes, systems, and staff that deliver the customer experience. Where a journey map shows what the customer sees, a service blueprint adds what's happening behind the scenes to make it happen.
- Empathy Maps often get used in conjunction with journey maps. An empathy map captures a single persona's thoughts, feelings, statements, and behaviors at a specific moment, rather than across a sequence of stages. Journey mapping uses that same empathy-map thinking at each stage to build the emotional layer of the full map. The two work best together. Empathy maps deepen the persona work, and journey maps spread that understanding across time.
5 Types of Journey Maps for Customer Experience
The type of map you build should match the question you're trying to answer. Which type should you use? It depends on where you are in the process and what decision the map needs to support.
-
Current State Map
A current state map documents the customer's actual experience today. It reflects what really happens, not what the team believes happens or what the process documentation says should happen. This is the most common starting point because it's the most useful for diagnosing problems.
It's also the map that produces the most surprises. Teams that build current state maps regularly find that their highest-friction moments are not where they expected them. A financial services company might assume customers find the loan application form most frustrating. The map often shows that the real friction comes after submission, during the days of silence when customers don't know the status of their application and aren't sure whether to follow up.
Disney's journey mapping work at its theme parks produced the same finding. Designers expected emotional low points to cluster around specific attractions. What the map revealed was different: the highest customer frustration wasn't tied to any ride or show but the experience of waiting in a queue without knowing how long that wait would last. That single insight led to queue-time displays and eventually the FastPass system, both of which addressed the uncertainty rather than the duration. The friction the map surfaced was not the one the team went in expecting to find.
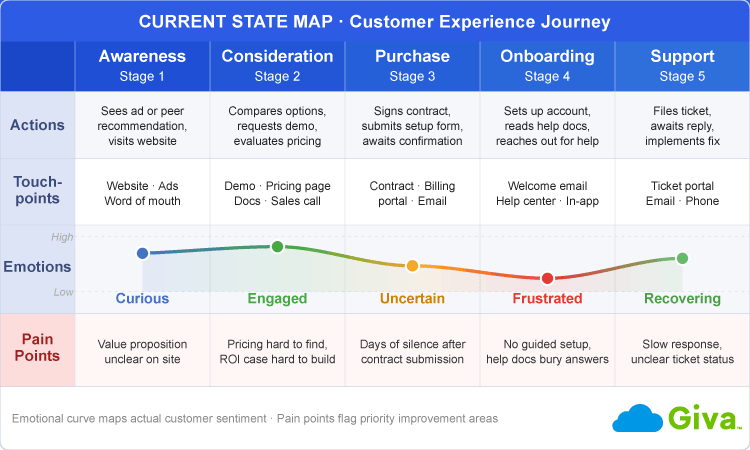 Customer Experience Journey Example Current State Map
 -
Future State Map
A future state map describes the experience the organization wants to create. It represents the target and not today's reality.
Strategic planning and internal alignment are where future state maps earn their value. When different teams have different ideas about what a better experience looks like, a future state map creates a shared reference point. Without one, "improving the customer experience" often means five different things to five different departments.
Future state maps are often built at the end of a current state mapping exercise, when the gap between where things are and where they need to be is clear enough to define a target.
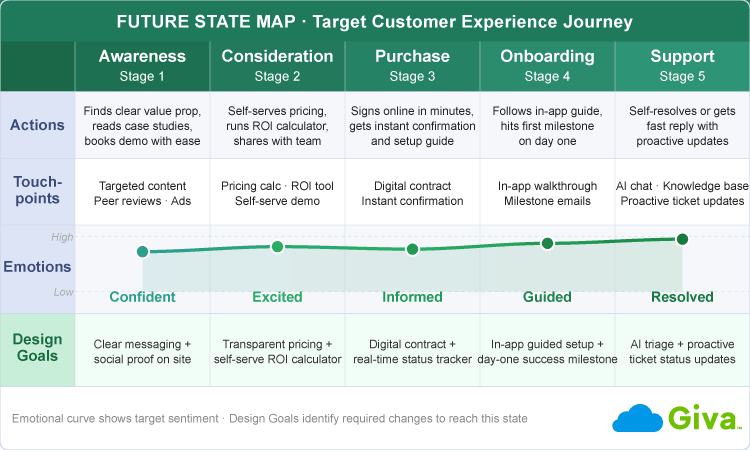 Customer Experience Journey Example Future State Map
 -
Day-in-the-Life Map
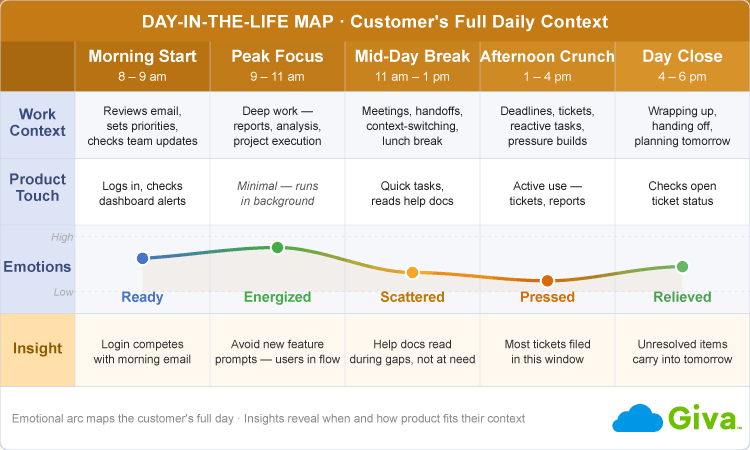
A day-in-the-life map zooms out beyond the brand relationship to capture the customer's full daily context. It shows how the product or service fits into their broader life or workday, including the moments before and after they interact with the company.
Product teams find day-in-the-life maps especially useful for uncovering unmet needs that standard journey data doesn't surface. If you want to understand why customers aren't using a feature, a day-in-the-life map often reveals that the timing of the interaction doesn't fit how they actually work. It ends up being a timing issue and not a feature issue.
Day-in-the-life mapping is less common than current state mapping and requires more upfront research investment, but it tends to produce insights that internal data and touchpoint analysis alone cannot.
 Customer Experience Journey Example Day in the Life Map
 -
Service Blueprint
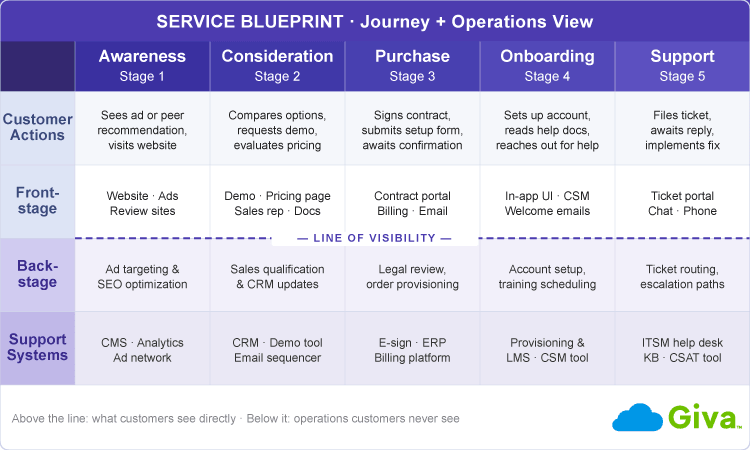
A service blueprint extends the customer-facing journey map to show the internal processes, systems, and staff that deliver the experience. The customer's journey sits at the top of the blueprint. Below it are three layers:
- Front-stage actions: What happens in direct customer contact
- Back-stage actions: What happens internally to support those interactions
- Supporting infrastructure: The systems and tools involved
Operational design and cross-functional accountability are where service blueprints add value that standard journey maps can't. When a customer experience problem traces back to a handoff between two departments, a basic journey map won't show it. A service blueprint will.
 Customer Experience Journey Example Service Blueprint Map
 -
Buyer's Journey Map
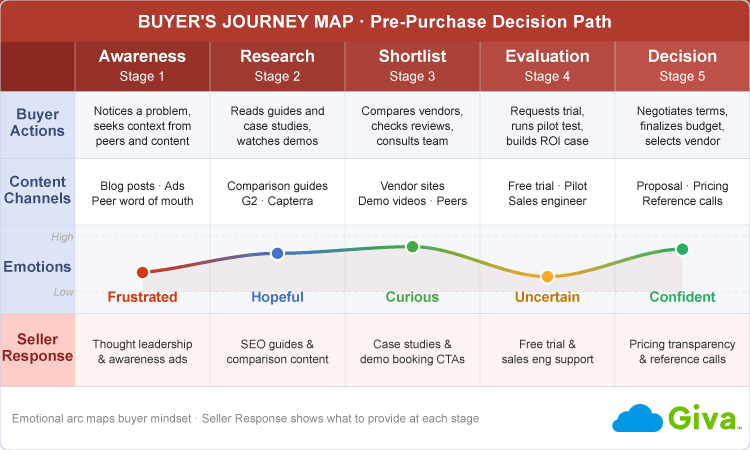
A buyer's journey map focuses exclusively on the pre-purchase experience, from the moment a prospect first becomes aware of the company through to the point of conversion. It's the map most aligned with marketing and sales goals.
A buyer's journey ends at purchase. The full customer journey includes everything that happens after the sale, which is often where CX investment pays off most. Conflating the two can lead marketing and CX teams to optimize different things and call them both "customer journey work."
 Customer Experience Journey Example Buyer's Journey Map
Types of Customer Journey Maps for CX at a Glance
Type |
Focus |
Best Used For |
Primary Stakeholders |
Current State Map |
The customer's actual experience today |
Diagnosing friction and identifying problems |
CX, Support, Operations |
Future State Map |
The ideal experience to create |
Strategic planning and CX vision alignment |
CX, Leadership, Product |
Day-in-the-Life Map |
Customer's full daily context, beyond your brand |
Product innovation, uncovering unmet needs |
Product, Marketing, Research |
Service Blueprint |
Customer journey + internal processes and systems |
Operational design and cross-functional accountability |
Operations, IT, Service Design |
Buyer's Journey Map |
Pre-purchase experience, awareness to conversion |
Marketing and sales alignment |
Marketing, Sales |
Why Customer Experience Journey Mapping Matters
Customer experience journey mapping matters because it surfaces the friction points, emotional gaps, and cross-channel handoffs that standard satisfaction data doesn't capture, making the invisible parts of the customer relationship visible to everyone who shapes it.
CX programs that manage the full customer journey consistently outperform those that optimize interactions in isolation. Customer perception forms across the arc of an experience, not at individual moments. A single improved interaction surrounded by friction rarely changes how customers feel about the overall relationship.
Qualtrics XM Institute found that consumer NPS averages 19 points higher when customers feel that none of their journeys need improvement. Yet only about half of CX programs currently gather journey-level feedback, compared to three-quarters that collect relationship or interaction-level scores. Most programs measure what is easiest to collect, not what best reflects whether the overall experience is working.
Cross-Functional Alignment
Journey mapping does something that surveys and dashboards can't. It forces different functions to look at the customer experience together. Marketing, product, support, and IT often have genuinely different mental models of what customers go through, and a shared map makes those differences visible and productive.
One streaming platform used customer journey mapping when adding social sharing features to their app. Rather than adding sharing options at every step, they mapped the actual listening journey to find the moments when users felt most connected to a track. The placement that resulted reflected how people actually moved through the app, not what the product team assumed they wanted. The map gave the decision a foundation that internal debate alone couldn't provide.
The Map-to-Action Gap
Worth saying plainly: Having a journey map doesn't mean your experience will improve. They get presented, admired, and filed away. The ROI from journey mapping comes almost entirely from what happens after the map is built, and that part is genuinely hard to get right.
The organizations that see results treat the map as a management tool, not a research deliverable. They assign owners to specific gaps, connect improvements to metrics, and review the map on a regular schedule. The ones that don't see results built a great presentation.
Key Elements of a Customer Journey Map
-
Journey Stages
Most journey maps organize the experience into five broad phases:
- Awareness: How customers discover the company
- Consideration: How they evaluate it
- Purchase: How they become customers
- Retention: How they continue using the product or service
- Loyalty or advocacy: How they become repeat buyers or referral sources
For B2B companies, these phases often involve multiple stakeholders within a single account. The evaluator, the budget approver, and the daily end user may each have a distinct experience of the same company. Effective B2B journey mapping accounts for all of them.
The exact phase names and boundaries also vary by industry and business model. A B2C subscription business may bring awareness and consideration together into a short window of days. An enterprise software sale may have a consideration phase that spans months and involves multiple decision-makers. These phases collectively map to the customer lifecycle, the full arc of a customer's relationship with a company from first awareness through renewal or churn.
-
Customer Personas
A persona is the "actor" in the journey, a research-based profile of a specific type of customer. Personas built from real customer data produce maps that reflect actual behavior. Personas built from internal assumptions produce maps that confirm what the team already believed.
A practical starting point is to work with two to four personas representing your most important customer segments. Mapping every possible customer type creates complexity that's hard to act on. Start with the segment that matters most to your current business problem.
-
Touchpoints
A touchpoint is any moment when a customer interacts with your company, directly or indirectly. The category spans everything from the website and support channel to the invoice and renewal notice.
Don't overlook operational touchpoints that rarely get mapped. Automated transactional messages like confirmation emails and status updates don't feel like "CX moments" to the teams that produce them, but customers experience them as part of the relationship. Missing them is one of the most common gaps in first-time journey maps.
Omnichannel journeys, those spanning web, mobile, phone, and email channels, add another layer of complexity. When customers move across web, mobile, phone, email, and in-person channels within the same scenario, each channel transition is a potential friction point. Mapping which channels customers actually use at each stage, and how well the experience holds across those transitions, is one of the more revealing aspects of journey work for organizations with multiple service channels.
-
Customer Emotions and Pain Points
The emotional curve is the layer that separates a useful journey map from a process diagram. At each stage, the map records how the customer feels, whether confident, confused, frustrated, or anxious. Plotting this curve across the journey reveals the emotional momentum of the experience, something satisfaction scores alone don't show.
Teams are often surprised by where the emotional low points actually fall. A healthcare software company might assume patients find the billing portal the most frustrating part of their experience. The map might show that it's actually the week between signing up and receiving login credentials, when patients feel uncertain about whether anything is happening. The frustration is in the silence, not the interaction itself.
Mapping the emotional curve in a workshop setting with representatives from multiple departments present often produces a different result than any single team would reach independently. Each department tends to see their own touchpoints clearly and the gaps between departments less clearly. The shared exercise is what changes that.
Not every touchpoint carries equal weight in shaping perception. Practitioners often call the interactions with disproportionate impact "moments of truth," the specific service interactions or product experiences that most define whether a customer recommends, renews, or churns. Journey mapping is one of the few tools that makes these moments visible before the survey data arrives, so organizations can invest in what actually matters.
-
Opportunities
Opportunities are where the map earns its value. Each gap between what customers expected and what they actually experienced is a candidate for improvement. The practical challenge is prioritizing them. A simple two-axis framework asks how much impact an improvement would have on the customer experience, and how feasible it is to deliver given current resources.
High-impact, high-feasibility gaps go first. Knowing where to start is often more valuable than knowing everything that's wrong.
-
Supporting Data Sources
A customer journey map is only as accurate as the data behind it. Two types of data feed a good map:
- Solicited data: Customer interviews, surveys, focus groups, and NPS comments. This tells you what customers say about their experience.
- Unsolicited data: Support ticket analysis, call recordings, session replay tools (software that records and replays user interactions on your website), website analytics, and churn interviews. This tells you what customers actually do, regardless of what they say.
Both matter. Solicited data captures conscious opinions, and unsolicited data captures actual behavior. The two often disagree, and the disagreements are usually where the most important insights are.
How to Create a Customer Experience Journey Map
Building a customer experience journey map involves eight steps: define your goal and scope, choose the right map type, build a persona from real customer research, identify all touchpoints, gather behavioral and attitudinal data, map emotions and pain points, identify improvement opportunities, and activate the map with named owners and metrics:
-
Step 1: Define Your Goal and Scope
Before any research or visualization starts, define what the map needs to answer. Which customer? Which journey? What decision will the map inform? A map built without a clear question tends to become a comprehensive documentation project with no actionable output.
Scoping keeps the work manageable. "Map the enterprise onboarding journey for our mid-market segment" is actionable. "Map our complete customer experience" is a multi-year project.
-
Step 2: Choose the Right Map Type
The map type follows directly from the goal you defined in Step 1. If you're diagnosing what's broken, start with a current state map. If you're designing what comes next, build a future state map. If you're investigating why customers aren't adopting a feature, a day-in-the-life map may reveal context a standard journey map won't.
-
Step 3: Build or Select a Customer Persona
Use real research rather than internal consensus. Customer interviews are the most direct source. Five to eight in-depth conversations with customers who represent the segment you're mapping will reveal behavioral patterns and emotional details that survey data alone misses.
If personas already exist in your organization, validate them against recent customer data before using them. Customer behavior and expectations shift. A persona built two years ago may not reflect who your customers are today.
-
Step 4: Identify All Touchpoints
A complete touchpoint inventory covers every point of contact between the customer and your company across every channel and every stage of the journey. Include the obvious ones (the product, the support channel, the sales call) and the ones that get overlooked (the system-generated confirmation email, the invoice, the error message when something fails).
A useful technique is to ask your support team what questions customers raise most often in their first 30 days. The answers reveal touchpoints that aren't working, even if the team doesn't think of them as service interactions.
Organizing the full touchpoint list by journey phase, and noting which channel each touchpoint occurs in, gives the map a structure that makes gaps visible at a glance. When you see a long gap between two touchpoints in the same phase, that gap is often where the experience quietly falls apart.
-
Step 5: Gather Customer Data
Collect both solicited and unsolicited data across the touchpoints you identified. Customer interviews and surveys give you the "what customers say" layer. Support tickets, call recordings, session analytics, and churn interviews give you the "what customers actually do" layer. Teams working from a structured help desk platform have a built-in advantage here: ticket history, contact reason patterns, and repeat-contact rates are among the richest behavioral signals for identifying where customers consistently encounter friction.
Churn interviews deserve specific mention. Conversations with customers who left are among the richest sources of journey data available, and most companies never conduct them. For day-in-the-life mapping specifically, diary studies, in which participants self-document their experiences over days or weeks, can capture behavioral context that a single interview session misses.
-
Step 6: Map Emotions, Thoughts, and Pain Points
With your data in hand, plot the emotional curve across each journey phase. For each stage, document:
- What the customer is thinking
- What they're feeling
- Where they encounter friction
Color-coding the emotional states (positive, neutral, negative) across the map makes the low points visible quickly. This is the step where most maps reveal something the team didn't expect. Document those surprises explicitly. They're the insights that justify the entire exercise.
Not every stage will yield insight in equal measure. Teams often find that two or three phases dominate the map, with the rest relatively frictionless. That concentration is useful data in its own right and tells you where to focus first.
-
Step 7: Identify Opportunities for Improvement
By this step, the map typically shows more opportunities than the team can realistically address at once. Document each divergence between customer expectations and actual experience, then prioritize by combining customer impact with organizational feasibility.
A practical reality about this step: Some of the highest-impact opportunities will be difficult to address, either because they involve systems that are hard to change, processes that cross multiple departments, or problems that have been normalized internally over time. Document those even if they're not the first things you fix. They often become the business case for a larger CX investment.
-
Step 8: Activate the Map and Keep It Current
This is the step where most programs stall, and there's no clean way around it. Activation requires assigning a named owner to each priority gap, connecting each improvement to a specific metric, and agreeing on a review schedule. Without that structure, the map becomes a presentation artifact.
Assigning "the CX team" as a blanket owner rarely works. The CX team typically doesn't control the email sequence, the billing system, or the product onboarding flow. Real accountability means a named person in the function that owns each touchpoint is responsible for the improvement, with a date and a metric attached.
Journey maps also go stale. Customer behavior, channel use, and product capabilities change. A quarterly review is the recommended minimum. When a major product change or channel launch occurs, update the map before customers experience it, not after.
Running the Journey Mapping Workshop
Journey maps are usually built in a group workshop setting. The typical format involves 8 to 12 participants drawn from all the functions that touch the customer journey, from marketing and sales to support, product, IT, and operations. Half a day is the typical minimum. Complex journeys often require a full day. The goal is not to produce a polished map but to uncover information that no single team holds alone.
Facilitator selection matters. The facilitator should not be a subject matter expert for the journey being mapped, because experts tend to fill in gaps from their own experience rather than from evidence. An independent facilitator whose job is to manage the process, not to contribute content, produces more honest maps.
The workshop ends with an agreement on who owns the top three to five priority gaps identified, and when they'll be addressed. Without that agreement at the close of the session, the output tends to just stay in the slide deck.
Choosing a Journey Mapping Tool
Most journey maps are created using whiteboard and collaboration software such as Miro or Lucidchart, dedicated journey mapping platforms such as Smaply or UXPressia, or presentation tools like PowerPoint or Google Slides. The right choice depends primarily on how the map will be used after the workshop. For a one-time discovery exercise, a whiteboard tool is usually enough. For a map that will be maintained, reviewed quarterly, and shared across the organization, dedicated software with structured fields for personas, stages, and metrics is worth the investment.
A frequent error in tool selection is choosing something that produces a beautiful static diagram. Static diagrams become stale and are difficult to update when the experience changes. The most useful journey maps are live documents, not presentation assets.
Common Mistakes in Customer Experience Journey Mapping
Journey mapping programs most often fail from the same causes: maps built on internal assumptions rather than customer research, findings without named owners, and a one-time project mentality rather than an ongoing management discipline:
-
Mapping Your Internal Process Instead of Your Customer's Experience
The most common and most damaging mistake is building a map that reflects how your organization is structured rather than how customers actually experience it. When each department contributes its own touchpoints, the result is a map of departmental responsibilities, not a map of customer experience.
When the map mirrors the org chart, it can't challenge the org. Insights appear where teams already look rather than where customers actually feel friction. The most painful parts of the customer journey are often the gaps between departments, and those gaps don't show up in a map that department heads built independently.
-
Building the Map Without Talking to Real Customers
Internal consensus about what customers feel is almost always wrong at specific pain points. Teams tend to be most confident about the stages they handle directly and most blind to the friction they've normalized over time.
A map built entirely from internal perspectives will validate current assumptions rather than challenge them. Even five to eight customer interviews, conducted before the mapping workshop, will reveal details no internal team meeting will produce.
-
Treating Journey Mapping as a One-Time Project
Journey maps built for a specific initiative and then filed away lose their value quickly. Customer behavior, competitive options, and product capabilities change. A map that isn't updated becomes a historical document, not a management tool.
-
Over-Optimizing Individual Touchpoints
Investing heavily in improving a single touchpoint while leaving surrounding friction in place is a common pattern, and the results are predictably disappointing. Research on end-to-end journey management consistently shows that journey-level improvements outperform touchpoint-level investments.
Perfecting the checkout experience while leaving a confusing post-purchase email sequence in place means customers feel great at purchase and frustrated immediately afterward. The satisfaction score from the checkout captures the win, but the churn data two months later captures the loss.
-
No Named Owner for Acting on Findings
So why do most journey maps end up on a wall? Because the responsibility for acting on them belongs to everyone in general and no one in particular. "The CX team will track this" is the most common way a mapping program quietly ends.
Every priority gap on the map needs three things:
- A named owner in the function that controls the touchpoint
- A specific metric tied to the improvement
- A timeline for delivery
The CX team's job is to connect the map to the people who can actually act on it and not own every gap themselves.
Measuring the Success of Your Journey Mapping Program
Measuring a journey mapping program means tracking whether the full customer experience improves over time and not just individual interactions through a combination of relationship-level (NPS), touchpoint-level (CSAT), and friction-specific (CES) metrics.
Journey mapping doesn't have a natural finish line. It's an ongoing process, and the measure of success is whether the experience improves over time. Three metrics form the core of most journey measurement frameworks, and each belongs at a different part of the journey:
- Net Promoter Score (NPS): Measures relationship-level loyalty by asking whether customers would recommend the company to others. NPS captures the cumulative effect of the full journey rather than any single interaction, making it the best long-term indicator that the overall experience is improving.
- Customer Satisfaction Score (CSAT): Measures how satisfied a customer was with a specific interaction. CSAT is most useful at individual touchpoints, collected immediately after a support interaction, onboarding session, or purchase. Comparing CSAT across touchpoints often shows exactly where in the journey the experience weakens.
- Customer Effort Score (CES): Measures how easy or difficult it was for a customer to accomplish a specific goal. CES is the most direct measure of friction at a given stage, and it's particularly useful at high-effort moments like issue resolution, account changes, or complex onboarding steps.
- Stage-specific conversion rates: Drop-off rates between awareness, consideration, and purchase signal where pre-purchase friction is highest. These metrics connect journey mapping to revenue outcomes.
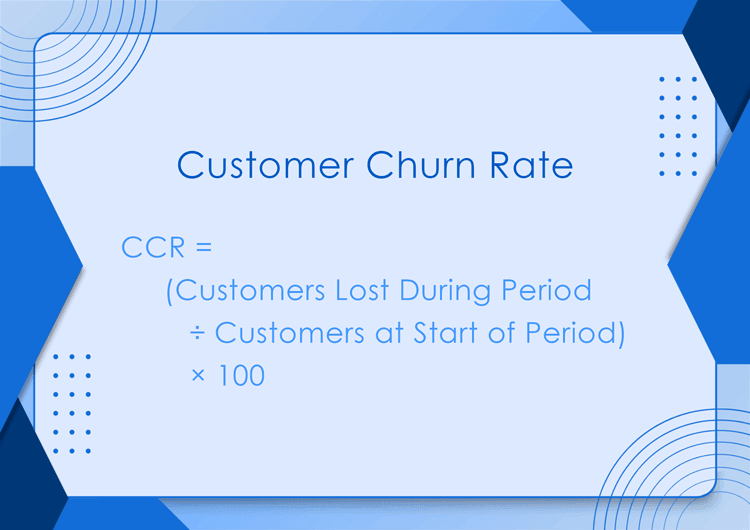
- Customer retention and churn rate: The long-term indicator that the full journey is working. Churn often has a specific source in the journey, and mapping can make that source visible before it compounds.
Practitioners often organize these metrics into two categories:
- Leading indicators, including CES, stage-specific drop-off rates, and task completion rates, signal early whether a recent change is having the intended effect.
- Lagging indicators, including NPS and customer retention, confirm whether the full journey is working at the relationship level over time.
Leading indicators give teams something to act on within weeks. Lagging indicators confirm that the changes worked at scale.
Journey analytics tools are an emerging category that automates some of this measurement by tracking customer behavior across channels in real time, flagging moments where customers deviate from expected paths. They don't replace the qualitative insight that journey mapping produces, but they make it easier to connect the map to live operational data.
Frequently Asked Questions About Customer Experience Journey Mapping
-
What is the difference between a customer journey map and a customer experience map?
A customer journey map tracks a specific persona through a specific scenario, while a customer experience map captures the broader brand relationship across all customer types and contexts.
A journey map is defined by scope. It focuses on one customer type, one scenario, and one goal, documenting what that customer experiences from start to finish.
A customer experience map is wider and less focused. It's designed to understand the overall impression customers form of the brand across all interactions, not to diagnose a specific journey. Both tools are useful, but for different purposes. Start with a customer journey map if you have a specific problem to solve.
-
How many customer journey maps does a company need?
Most companies should maintain two to four active journey maps covering their most important customer segments or journey types.
More maps create complexity that's hard to manage and harder to act on. The error most teams make is building maps for every possible scenario and then failing to act on any of them. A single well-maintained map for your highest-priority journey is more valuable than a library of maps nobody reviews.
Start by identifying the journey that most affects your key metric (churn, conversion, retention) and build that map first. Add others as the first one produces results and creates organizational appetite for the process.
-
What data do you need to build a customer journey map?
You need two types of data: solicited feedback (interviews and surveys) that captures what customers say, and unsolicited signals (support tickets, call recordings, analytics) that capture what they actually do.
For a first journey map, five to eight customer interviews with people representing your target segment, plus a review of support tickets and churn data, is enough to build a credible draft and identify the most important gaps.
You don't need to wait for a full data infrastructure before you start. An imperfect map built from real customer conversations is far more useful than a polished map built from internal assumptions.
As your mapping practice matures, behavioral data, session analytics, and journey analytics tools can add a quantitative layer on top of the qualitative foundation. But the qualitative foundation comes first.
-
How often should you update a customer journey map?
Quarterly reviews are the recommended minimum, with updates triggered by any major change to the product, pricing, service channels, or customer mix.
A quarterly review doesn't mean rebuilding the map from scratch. It means checking whether the emotional curve has shifted, whether new touchpoints have appeared, and whether the priority gaps from the previous review were addressed.
The most useful thing a regular review does is prevent the map from becoming a document that just continues to confirm the current experience rather than challenge it.
-
What is a service blueprint, and how is it different from a customer journey map?
A service blueprint extends a customer journey map by adding the internal processes, systems, and staff that deliver the experience, making the "backstage" operations visible alongside what the customer sees.
In a service blueprint, the customer journey runs across the top. Below it are the front-stage actions customers see directly, the back-stage work that happens internally, and the systems and tools that make both possible. Together these layers reveal the operational causes behind the customer experience.
Service blueprints are most valuable when a customer experience problem is caused by an internal process or a handoff between departments. If a customer's frustration with slow response times traces back to an understaffed routing queue, the journey map shows the frustration, and the service blueprint shows the cause.
Service blueprints take longer to build than standard journey maps and require input from multiple departments. For that reason, they're usually developed after a current state map has already revealed the friction areas worth investigating more deeply.
-
How do you get other departments to act on journey mapping findings?
The most effective approach is connecting each gap on the map to a metric that the responsible department already tracks, so the improvement becomes part of their existing goals rather than a request from the CX team.
Finance tracks billing-related churn. Marketing tracks conversion drop-off. Support tracks First-Contact Resolution (FCR). When a journey map finding is translated into those terms, it becomes a business problem the department owns rather than a CX recommendation they're being asked to implement.
Executive sponsorship helps considerably. Journey mapping findings that affect multiple departments rarely move without someone at the leadership level who can convene the right people and assign accountability. Building that sponsorship before the map is complete is more effective than trying to create it afterward.
Related Giva Resources
- B2B Customer Journey vs Experience Journey Mapping
- Customer Experience Strategy: How to Build & Improve CX
- CSAT vs NPS vs CES: Formulas Plus the Pros & Cons of Each
- Seamless Customer Experience: Top 10 Service Strategies
Making Customer Experience Journey Mapping Work
A journey map that nobody acts on is just a detailed presentation. What separates programs that produce results from the ones that produce binders isn't the quality of the diagram but whether someone owns the follow-through. Named owners, metrics, and a review cycle aren't complicated requirements. They're what turns the map into a management tool.
Journey mapping is one of the few CX practices that forces the people who create the experience to see it the way customers do. That shift is valuable on its own. But it pays off only when someone uses it to make a decision.
Turn Journey Map Insights into Better Service Interactions
Customer experience journey mapping reveals where the gaps are. The next step is having the service infrastructure to close them consistently, interaction by interaction.
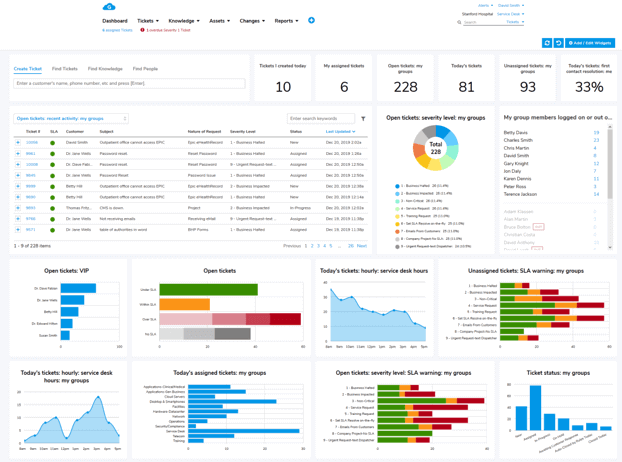
Giva's customer service software gives your team a single platform to manage every service interaction with full ticket history, so customers never have to repeat themselves from one touchpoint to the next. Real-time dashboards and reporting means your journey map has real operational data behind it rather than assumptions, and you can track whether the improvements you make are actually changing the experience.
Whether you're building your first journey map or trying to turn an existing one into operational action, the patterns in your support tickets often point directly to the friction on your map. Giva helps you see those patterns, act on them, and measure the results.
Get a demo to see Giva's solutions in action, or start your own free, 30-day trial today!


Categories: Customer Service