The 7 Most Critical Customer Service Metrics: Understanding the Subjective Customer Experience
 By Ron Avignone
Offering customer service is nuanced and different every single time. And on the customer's side, the experience is subjective. It's all about their perceived satisfaction with how the interaction went. Understanding the complexity and subjectivity of customer service interactions crystalizes the importance of customer service metrics. These metrics transform unorganized and subjective interactions into tangible data that a business can understand and improve.
In this article, we'll highlight the relationship between tracking metrics and the overall customer experience. We'll provide a rundown of seven of the most potent metrics customer support teams should pay attention to. Then, we'll discuss how equipping your team with the best tools supports their performance and leads to happier customers.

What Are Customer Service Metrics?
Customer service metrics are measurable data points that evaluate how effectively a business supports its customers. These metrics track performance across response times, resolution quality, customer satisfaction, and long-term loyalty, helping teams identify what's working and where improvements are needed.
Leading vs. Lagging Metrics
Not all customer service metrics serve the same purpose, and they can be grouped in these two ways:
- Lagging metrics (CSAT, churn) reflect past performance
- Leading metrics (FCR, response time) predict future outcomes
High-performing organizations prioritize leading indicators because they allow teams to fix issues before they impact customer satisfaction.
Overview of The 7 Most Important CS Metrics
Customer service metrics are essential because they help businesses understand how well they are meeting customer expectations and where service processes need improvement. Metrics reveal deeper insights into customer sentiment, team efficiency, and long-term customer loyalty.
When tracked and analyzed strategically, customer service metrics give service teams the evidence they need to improve service quality and build stronger customer relationships. The problem is, there can be too many to keep straight. So, let's take a look at seven of the most important metrics.
- Customer Satisfaction Score (CSAT)
- Net Promoter Score (NPS)
- Customer Effort Score (CES)
- First Contact Resolution (FCR)
- Average Resolution Time (ART)
- Customer Churn Rate (CCR)
- Average Abandonment Rate (AAR)
-
Customer Satisfaction Score (CSAT)
A CSAT score indicates customer satisfaction. The higher the CSAT score, the more satisfied customers are. The CSAT is important because it's the overall barometer of a business's services and performance. In other words, customer satisfaction is directly correlated to good or bad business.
How to Calculate
A CSAT score is first calculated with a survey question. For example, "Given your overall experience with our products and services, how satisfied are you?" The survey scale typically ranges from 1-10, 1-7, or 1-5, indicating varying levels of satisfaction. Scoring high on the survey indicates satisfaction.
CSAT is calculated by dividing the number of satisfied customers by the total number of responses, then multiplying by 100.
CSAT = (# of Satisfied Customers / Total # of Responses) x 100
Benchmarks
- For most industries, a CSAT score of 75-85% is considered strong.
- CSAT scores over 90% indicate an exceptional level of customer satisfaction, indicating high-quality customer service.
How to Improve
- Reduce response and resolution times so customers aren't left waiting
- Personalize interactions using customer history and context
- Follow up on negative feedback to show customers they've been heard
- Strengthen agent soft skills like empathy and clarity
-
Net Promoter Score (NPS)
The NPS measures customer loyalty by assessing their willingness to recommend a company to their peers.
Customers who are willing to promote a business are "promoters", and those who are not willing are "detractors". "Passive" customers are neither willing to promote nor to detract.
How to Calculate
A simple survey question is used to calculate the number of promoters and detractors. For example, "Given your overall experience with our products and services, how likely are you to recommend us to others?"
Then, to calculate an NPS score, subtract the percentage of detracting customers from the percentage of promoting customers.
NPS = % of Promoters - % of Detractors
Benchmarks
- A positive NPS shows there are more promoters than detractors.
- Most industries average between 20% and 40%.
- 50%+ is considered excellent, and top-performing companies come in with 70%+
How to Improve
- Quickly identify and recover detractors before they churn
- Analyze what promoters love and replicate those experiences
- Improve consistency across the entire customer journey, not just support
- Address recurring product or service issues that impact loyalty
- Use proactive outreach to build stronger long-term relationships
- Share NPS insights across teams to drive company-wide improvements
-
Customer Effort Score (CES)
A CES measures how much effort a customer must expend to use your product or service. The goal is to reduce customer effort. This is important because products or services that are easy to use create satisfied and loyal customers.
How to Calculate
CES scores are measured on a scale. There are two types of scales, text-based and numeric. Text-based scales range from "very easy" to "very difficult." On the other hand, numeric scales range from 1 to 5, where 1 indicates low effort and 5 indicates high effort.
A survey question gauges customer effort, for example, "How easy was it to use our service (or product) today?"
-
Text-Based CES Scale
With text options (e.g., Very Easy → Very Difficult), calculate the CES by subtracting the percentage of "difficult" responses from the percentage of "easy" responses. With text-based calculations, a higher CES indicates your service is easier to use.
CES = % of Easy Responses - % of Difficult Responses
-
Numeric CES Scale
With numeric scales (e.g., 1 = Very Easy and 7 = Very Difficult), calculate CES by dividing the sum of all ratings by the total number of responses. With a numerical CES calculation, a lower score indicates your service is easier to use.
CES = (Sum of Effort Ratings / Total # of Responses)
Benchmark
- With text-based CES calculations, a good benchmark is 70% or more of "Easy" and "Very Easy" responses.
- With numeric calculations, the benchmark is an average score of 1.5 to 2.5, indicating low effort expenditure.
How to Improve
- Simplify processes so customers can complete tasks in fewer steps
- Improve self-service tools like FAQs and knowledge bases
- Reduce the need for customers to repeat information across channels
-
-
First Contact Resolution (FCR)
The FCR metric is the percentage of customer service interactions that are completely resolved within the first interaction between a customer and a service representative. High FCR metrics indicate that customers have their issues resolved, be it via phone, email, or chat, the very first time they reach out.
The FCR is important because it highlights the proficiency of your customer service team. And in a multi or omni-channel contact center, it highlights which channels are most productive and which ones need improvement.
How to Calculate
To calculate the FCR as a percentage, divide the total number of customer service interactions that were solved during the first contact by the total number of interactions. Then, multiply by 100.
FCR = Total # of Interactions Resolved in the First Contact / Total # of Interactions x 100
Benchmarks
- A widely accepted industry FCR standard is between 70% and 79%.
- However, FCR benchmarks vary by channel. Self-service FCRs range from 30% to 50%, while live chat and email channels range from 55% to 70%.
How to Improve
- Equip agents with a well-organized, easy-to-search knowledge base
- Improve ticket routing so issues reach the right expert immediately
- Provide ongoing training to expand agent skill sets
- Use AI or guided workflows to support faster, accurate resolutions
- Analyze repeat contacts to identify and eliminate root causes
-
Average Resolution Time (ART)
The ART is the average time a customer service representative spends handling a customer interaction. The ART is an important metric to measure because it indicates individual employee performance. Longer ART metrics may indicate employees are under-trained or need more support.
How to Calculate
To calculate the ART, first find the total handle time for all resolved tickets. Then, divide that by the total number of customer service interactions.
ART = Total Handle Time for All Resolved Tickets / Total # of Interactions
Benchmarks
- Benchmarks can vary by contact center channel type. For example, a benchmark ART for live chat or phone interactions is 3 to 10 minutes, while an email ART benchmark is closer to 24 hours.
- Benchmarks can also vary by industry. Healthcare and fintech industries have shorter ART averages, ranging from 2 to 8 hours. While the SaaS and e-commerce industries have longer ART scores ranging from 12 to 24, sometimes up to 48 hours.
How to Improve
- Automate repetitive tasks and workflows where possible
- Prioritize tickets based on urgency and impact
- Improve collaboration between teams for faster escalations
- Identify and remove bottlenecks in the resolution process
-
Customer Churn Rate (CCR)
When a customer "churns", they leave a company or stop using their services. Therefore, the CCR indicates how many customers a company has lost over a specific period. CCR is important to track because it helps identify the precursor behaviors that lead to churn. It's important to maintain a low churn rate because it costs more to acquire new customers than to retain current ones.
How to Calculate
First, identify the calculation time. For example, monthly, biannually, or annually. Then subtract the number of customers at the end of that period from the number at the start. This gets you the total number of lost customers. Then, divide that result by the total number of customers at the start and multiply by 100.
CCR = (# of Lost Customers / Total # of Customers) x 100
Average Benchmarks
- Churn rates will vary based on industry. For example, subscription and SaaS companies strive to keep monthly churn below 3%.
- Most businesses target a monthly CCR under 5% or an annual CCR below 20%
How to Improve
- Monitor customer behavior for early signs of dissatisfaction
- Act quickly on negative feedback or declining engagement
- Improve onboarding to help customers realize value faster
- Deliver consistent, high-quality support experiences
- Use targeted retention efforts based on customer data
-
Average Abandonment Rate (AAR)
Abandoned calls are those that end before a customer speaks with a service representative. Normally, customers abandon calls when the wait time becomes too long. The AAR shows the number of abandoned calls over a specific period.
The AAR is important because it gauges your contact center's efficiency. A high AAR indicates that wait times are too long, typically due to inefficient call routing or insufficient staff during peak times. It's a precursor to overall customer satisfaction.
How to Calculate
To calculate the AAR as a percentage, divide the number of abandoned calls by the total number of incoming calls and then multiply by 100.
AAR = (# of Abandoned Calls / Total # of Incoming Calls) x 100
Average Benchmarks
- Well-managed contact centers strive for 5% or less
- When abandonment rates reach 8-10%, there are clear issues with staffing and contact center efficiency.
How to Improve
- Optimize staffing to better handle peak demand periods
- Offer callback options to reduce hold time frustration
- Improve call routing to connect customers faster
- Provide alternative support channels like chat or self-service
- Monitor queue data in real time and adjust resources accordingly
- Set clear expectations for wait times when delays occur
Customer Service Metrics Summary Table
Metric |
What It Measures |
How It's Calculated |
Typical Benchmark |
Primary Goal |
Customer Satisfaction Score (CSAT) |
Overall customer satisfaction with products and services |
(# of satisfied customers / total responses) x 100 |
Strong: 75-85% |
Improve overall customer satisfaction |
Net Promoter Score (NPS) |
Customer loyalty based on willingness to recommend |
% Promoters - % Detractors |
Average: 20-40% |
Increase customer loyalty and advocacy |
Customer Effort Score (CES) |
How easy it is for customers to use a product or service |
Text: % Easy - % Difficult |
Text: 70%+ "Easy/Very Easy" |
Reduce customer effort and friction |
First Contact Resolution (FCR) |
Percentage of issues resolved during the first interaction |
(First-contact resolutions / total interactions) x 100 |
Standard: 70-79% |
Resolve issues on the first interaction |
Average Resolution Time (ART) |
Average time spent resolving customer interactions |
Total handle time / total interactions |
Chat/phone: 3-10 minutes |
Reduce time to resolution |
Customer Churn Rate (CCR) |
Percentage of customers lost over a given time period |
(Lost customers / total customers at start) x 100 |
Monthly: <5% |
Improve customer retention |
Average Abandonment Rate (AAR) |
Percentage of customer contacts abandoned before reaching support |
(Abandoned contacts / total incoming contacts) x 100 |
Well Managed: <5% |
Reduce wait times and lost interactions |
How The Right Tools Can Help Design Customer Service Strategy
To track customer service metrics you need the correct tools. For most customer service teams, a blend of help desk application, survey tool, and reporting tool provide the most robust information to guide the development of a customer service strategy.
- Help desk applications track tickets, response times, resolution rates, and individual agent performance.
- Survey tools help collect data about CSAT, NPS, and CES via collecting post-interaction feedback.
- Reporting tools help bring everything to life with visual dashboards that empower you to track trends.
Customer Service Data Is The Key To Better Service Quality
In a world where customers expect fast, consistent, and personalized support, the real value of metrics is not just in measuring performance, but in revealing patterns via data.
The most effective teams use data like customer service metrics not as a one-off pass or fail report card. But instead, as an ongoing strategic system that highlights where the customer journey is breaking down, where agents need support, and where service can become a competitive advantage.
The result? Boosted operational efficiency, and, most importantly, improved overall customer satisfaction and loyalty.
Customer service metrics are performance indicators and early warning systems and growth drivers. The organizations that outperform their competitors are not the ones tracking the most data, but the ones using the right metrics to guide smarter, faster decisions across the entire customer journey.
Customer Service Metrics FAQs
What are the most important customer service metrics?
The most important metrics include CSAT, NPS, FCR, resolution time, and churn rate, as they directly reflect customer satisfaction and business impact.
What is a good customer service KPI benchmark?
Benchmarks vary, but CSAT above 80%, NPS above 50%, and FCR above 70% are generally considered strong.
How do you measure customer service performance?
Performance is measured using a combination of customer feedback metrics, operational efficiency metrics, and long-term loyalty indicators.
Giva Has The Customer Service Tools You've Been Missing
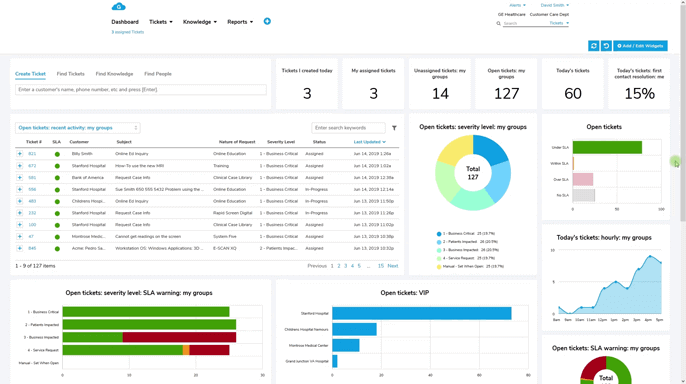
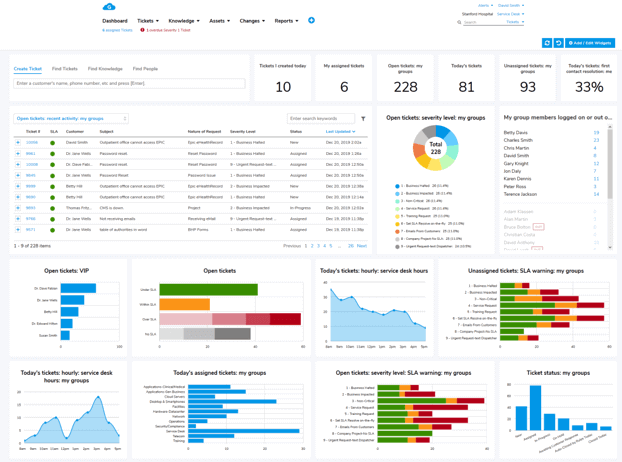
Giva's Customer Service Dashboard
Giva created two solutions to help you improve your customer service: a customer service tool and help desk application.
Giva's customer service tool is AI powered and HIPAA compliant. It harnesses AI technology to quickly resolve issues and automate smart workflows. It produces highly visual dashboards, with charts, reports, and graphs to guide immediate and actionable insights.
Giva's help desk software boosts productivity and visibility of customer service in real time. It features customizable dashboards and a streamlined operation for speed and simplicity. Like the customer service tool, Giva's help desk software is HIPAA compliant and powered by AI technology.
A Giva Case Study: EDIMS
EDIMS has continuously delivered evidence-based best practices to hospital emergency rooms through its information systems. Its flagship Electronic Health Record (EHR) solutions are used at hospitals and long-term care facilities nationwide by over 2,000 physicians and staff to fully document emergency department patient encounters. They deployed Giva's Customer Service and Knowledge Management software and enjoyed massive results:
- 30% increase in productivity by using Giva dashboards and reports
- Eliminated 24 hours/month of work to prepare reports
- 50% decrease in time required to open cases
- 50% easier to navigate and search Giva
- 100% faster application responsive/speed
Get a demo to see Giva's solutions in action, or start your own free, 30-day trial today!


Categories: Customer Service