Help Desk Best Practices: What They Are and How to Address The 4 Silent Failure Points
A help desk manager checks every box. There is a real ticketing system, defined Service Level Agreements (SLAs), a knowledge base agents actually use, and a metrics dashboard that refreshes every morning. And ticket volume keeps climbing anyway. The same Virtual Private Network (VPN) issue gets logged for the fourth time this month. An agent who closed 22 tickets yesterday gets praised in the team meeting, while the one who spent three hours actually fixing a recurring printer problem gets nothing. When leadership asks what the help desk accomplished last quarter, nobody has a clear answer.
This article covers the standard practices that keep a help desk running well, and gives each one enough depth to actually put into practice. Then it gets into the real differentiator. There are specific ways a help desk quietly breaks down even when every one of those standard practices is technically in place, covered here as "The 4 Silent Failure Points."

Key Takeaways
- The standard practices matter, but they are not the whole story: Most help desks already have a ticketing system, SLAs, a knowledge base, and the rest in place, so having them does not by itself explain why performance problems persist.
- Most help desk dysfunction traces back to one of four specific breakdowns: Repeat-Ticket Blindness, Metric Mirage, the Say-Do Gap, and Invisible Value, each covered in depth below.
- A high reopen rate is measurable, and still gets ignored: Most teams already track reopens as a KPI, but few treat a rising reopen rate as a signal to dig into the underlying cause instead of just closing the ticket again.
- Chasing activity metrics quietly rewards the wrong behavior: Tracking tickets closed per day or Average Handle Time (AHT) without also tracking outcomes can make rushed, incomplete work look more productive than it is.
- Escalation policies usually fail from lost context, not lack of discipline: What an agent already tried, and why it did not work, often does not survive the handoff between support tiers unless someone deliberately writes it down.
What Are Help Desk Best Practices?
Help desk best practices are the operational habits, like a shared ticketing system and clearly defined SLAs, that keep IT support consistent as ticket volume grows.
Most of these habits are already well established, usually centered on a centralized ticketing system, defined SLAs, a knowledge base, automation, proactive monitoring, and a small set of Key Performance Indicators (KPIs). Doing them well is genuinely worth the effort, and each one gets real depth in the next section. The harder, more useful question is whether a team already doing all of that is actually getting the results it should, and that is what the rest of this article is built to answer.
The next section covers those nine practices with enough depth to put them into practice, each linking to where Giva goes deeper. After that, this article gets into its core argument. There are four specific ways a help desk keeps underperforming even after every one of those nine boxes is checked.
9 Foundational Help Desk Best Practices
These nine practices are the foundation of a well-run help desk. Getting them right is what keeps day-to-day operations consistent and predictable, and each one below includes a link to where Giva covers it in real depth:
-
Centralize Ticket Intake and Routing
A single system that captures every channel, email and chat included, gives agents one queue to work from instead of five separate inboxes. It also gives managers one place to see backlog and load across the team.
Routing matters as much as capturing. Sending a ticket to an agent who already specializes in that request type, with the requester's past tickets visible, is what actually makes first contact resolution realistic instead of a stat teams wish were higher.
See Giva's ITSM ticket management article for how categorization and routing work in practice.
-
Automate Repetitive, Low-Complexity Work
Password resets, routine access requests, and stale-ticket cleanup rarely need a human touch. Automating them frees agents for the tickets that actually require judgment. The risk runs the other way too: over-automate and a team starts losing the human judgment calls that catch an edge case before it becomes an outage.
Giva's service desk automation guide covers where automation helps and where it quietly causes new problems.
-
Maintain a Knowledge Base
A searchable, actively maintained knowledge base cuts resolution time and gives users a way to fix common issues themselves. It only works if someone owns keeping it current.
Giva's guide on using AI to manage knowledge articles without losing accuracy covers how that upkeep actually gets done.
-
Set SLAs That Are Realistic and Enforced
An SLA only matters if it is realistic enough to hit and someone actually checks compliance at more than just the overall team level. A response-time target that looks fine in aggregate can still be badly missed for one request type or one shift, and the aggregate number will hide it.
Giva's SLA breach root cause analysis article covers what to do when the targets keep slipping.
-
Use AI Deliberately, Not Just for Deflection
AI is most useful for triage, drafting responses, and summarizing long threads, not just deflecting contacts away from a human.
Giva's help desk AI guide walks through where that distinction actually plays out.
Track a Small Set of Outcome-Focused KPIs
A short list of outcome-focused numbers beats a long dashboard of activity numbers. First Contact Resolution (FCR), Mean Time to Resolution (MTTR), and reopen rate all say more about whether an issue actually got fixed than tickets closed or calls answered ever will.
Giva's help desk metrics article covers which ones are worth tracking. The Metric Mirage section below goes deeper on why the wrong ones are so easy to default to.
-
Onboard and Train Agents Deliberately
A structured, week-by-week onboarding program gets new agents to solo tickets faster and with fewer mistakes than ad hoc shadowing.
Giva's week-by-week analyst onboarding program lays out what that actually looks like.
-
Protect Agent Capacity and Well-Being
A help desk that runs its agents into the ground eventually loses its most experienced people, which quietly undoes every other practice on this list.
Giva's guide on help desk and call center burnout signs and prevention covers the early warning signs.
-
Monitor Ticket Trends and Address Problems Proactively
Watching ticket volume and category trends in real time, rather than only after a spike, makes it possible to catch a recurring infrastructure or software issue before it turns into a wider outage. The Repeat-Ticket Blindness section below covers what happens when this practice gets skipped.
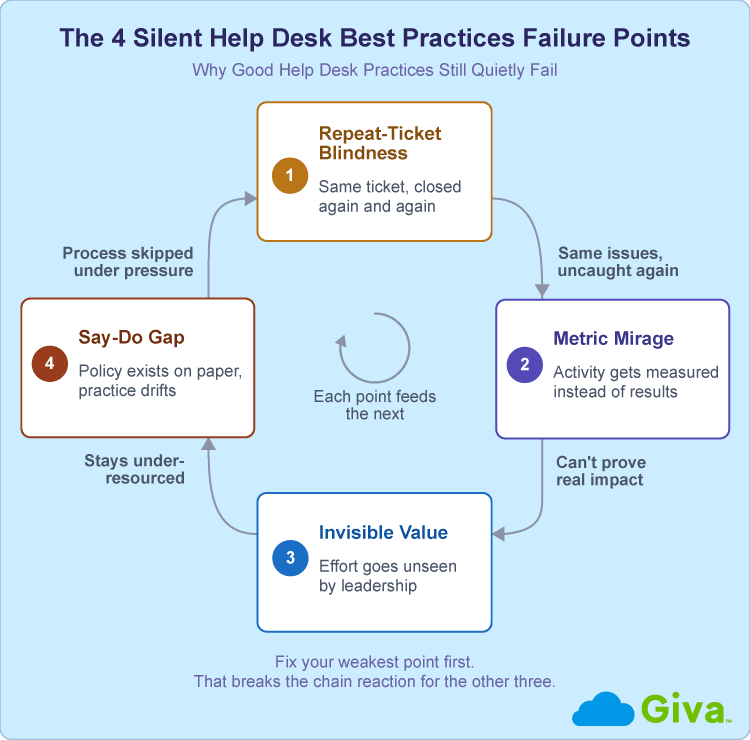
The 4 Silent Failure Points: Why Good Help Desk Practices Still Quietly Fail
Doing all nine of those practices well is necessary, but it is not the same as understanding why a help desk can still miss its own SLAs, burn out agents, or lose the budget argument every year even while doing them. That gap almost always traces back to one of four quiet breakdowns.
-
Repeat-Ticket Blindness
Repeat-Ticket Blindness happens when the same issue gets closed over and over instead of root-caused once. A user contacts the help desk about VPN access, the agent resets something, and the ticket closes. Two weeks later, the same user contacts the help desk about the same problem, and it closes the same way. Each ticket looks resolved on its own. Nothing about the actual cause ever gets fixed.
According to KPI Depot's benchmark data, a good ticket reopen rate falls below 10%, and rates below 5% are considered exceptional. Most teams already track this number. Few of them treat a rising reopen rate as a reason to dig into why rather than a reason to just close the ticket faster the second time. Giva's ticket reopen rate causes article breaks down the most common root causes, from incomplete first fixes to knowledge base gaps that never get filled.
The same blindness often shows up in SLA reporting too. A ticket can technically hit its resolution-time target and still be the same issue coming back the following week, which is a root-cause problem showing in a different metric.
Fixing this rarely means slowing agents down. It usually means someone reviewing closed tickets by category once a week, not per ticket, and asking a narrower question, "Did this category generate three or more tickets from the same cause this month?" A repeated category is a signal to open a problem record and fix the underlying cause once instead of quietly re-closing the symptom every time it comes back. The ITIL® framework calls this discipline Problem Management. Where Incident Management asks how to fix the ticket in front of an agent right now, Problem Management asks why the same ticket keeps showing up in the first place.
-
Metric Mirage
Metric Mirage is what happens when a team optimizes for activity instead of outcomes. Tickets closed per day, Average Handle Time (AHT), and calls answered per hour are all easy to measure and easy to put on a dashboard. None of them say anything about whether the underlying problem actually got fixed.
Economist Charles Goodhart summed up the underlying trap decades before ticketing software existed, "When a measure becomes a target, it ceases to be a good measure."
An agent who closes 20 tickets a day by moving fast looks more productive than one who closes 8 after actually tracking down a root cause. The dashboard rewards the first agent. The second agent is probably the one preventing next month's ticket spike.
The same pressure shows up in how agents work a queue. Faced with a backlog of similar-priority tickets, it is easy to cherry-pick the easy ones and leave the genuinely hard tickets aging at the bottom, which keeps the daily closed-ticket count looking healthy while the real backlog quietly grows.
So why do teams keep measuring the wrong thing when most managers already know better? Usually because volume and speed are what is easy to report up the chain, while outcome metrics like reopen rate or root-cause resolution take more work to track and explain.
This is exactly the gap the outcome-focused KPI practice above is meant to close, by joining an activity number with an outcome number for every metric a team reports. Here is what that pairing looks like for the three activity metrics already mentioned in this section:
Activity Metric
Outcome Metric
Tickets Closed per Day
Reopen Rate
AHT
FCR
Calls Answered
Customer Satisfaction
-
The Say-Do Gap
The Say-Do Gap is the space between a written escalation policy and what actually happens once a ticket gets difficult. Most help desks have a documented process for when to escalate and to whom. Fewer of them have any real way to tell whether agents are following it once the queue backs up.
The reason usually is not a lack of discipline. Escalation is built as a handoff, where a ticket moves to a new queue or a new assignee while the context that mattered stays behind. What the first agent already tried, why it did not work, and what the user actually said rarely survive the move unless someone deliberately writes it down in the ticket itself.
A Tier 2 agent picking up an escalated ticket often starts from close to zero. The handoff note might say only "escalating per policy," with nothing about what was already ruled out. That agent re-asks the user the same troubleshooting questions Tier 1 already asked, the user gets frustrated at repeating themselves, and the resolution takes longer than it should have. The policy was followed, but the handoff still failed the user anyway.
There is no clean way to measure this from the outside. A team can audit whether a policy exists on paper. Auditing whether it is actually followed though, ticket by ticket, under real time pressure, is much harder, and most help desks do not have a good answer for how they would even check.
One practical way around that is to stop trying to audit compliance after the fact and build the requirement into the handoff itself. A short, required field at the moment of escalation, filled in before the ticket can move to the next tier, forces the context to travel with it instead of depending on whether an agent remembered to write it down. A Tier 2 agent who opens a ticket with that field already completed does not have to re-ask what Tier 1 already covered.
-
Invisible Value
Invisible Value is what happens when the work a help desk actually does never makes it into a form leadership can use. Agents fix hundreds of issues a month, prevent outages nobody outside IT ever hears about, and still get treated as a cost center to be trimmed rather than a source of measurable business value.
For example, Apptio's 2026 Technology Investment Management Report found that 90% of technology leaders say uncertainty about return on investment is affecting how their organizations make investment decisions. A help desk that cannot clearly show its own return is an easy target when budgets get reviewed.
Giva's guide on proving that IT is contributing to business value covers how to make that case directly, and the IT help desk weekly reports article covers how often to report and to whom, so the case stays current instead of a once-a-year scramble.
A dashboard full of ticket counts and AHT figures does not answer the question a Chief Financial Officer (CFO) usually cares about most, which is closer to, "What would break if this team were smaller?" A report built around prevented outages, reduced repeat volume, and faster resolution on the issues that matter most answers that question directly. The gap is usually a lack of translation into something understandable and not lack of data itself, although a team that never captured the data in the first place has a different, earlier problem.
Summary of The 4 Silent Failure Points
The four failure points above all connect:
- A team that measures the wrong things cannot prove its real impact to leadership
- Which leaves it under-resourced
- Which means written process gets skipped the first time a queue backs up
- Which means the same issues keep recurring uncaught
- Which shows up right back in the very metrics nobody was looking at correctly in the first place
To remedy that, each failure point has its own symptom, root cause, and place to go deeper:
Failure Point |
What It Looks Like |
Root Cause |
Where to Go Deeper |
|---|---|---|---|
Repeat-Ticket Blindness |
The same issue closes and reopens repeatedly |
Tickets get closed instead of root-caused |
Ticket Reopen Rate: Causes and Fixes |
Metric Mirage |
Dashboards look good, outcomes do not improve |
Activity gets measured instead of results |
Help Desk Metrics |
Say-Do Gap |
Escalations stall or bounce between tiers |
Context is lost at the handoff, not policy ignored |
In development |
Invisible Value |
Leadership questions IT spend despite real output |
Reporting shows activity, not business impact |
Proving IT Business Value |
Help Desk Best Practices Four Silent Failure Points Diagram
Where to Start: Prioritizing the 4 Failure Points
Not every team has all four failure points running at once, and trying to fix all four at the same time usually means fixing none of them well. Most teams can point to one that is doing the most damage right now, once they stop to look for it instead of reaching for the nearest common best-practice checklist item.
Which of these four is actually costing your team the most right now? Here is a quick way to prioritize:
- If the reopen rate keeps climbing and the same handful of issues keep resurfacing, start with Repeat-Ticket Blindness.
- If the dashboard looks fine but backlog and burnout keep getting worse anyway, that is Metric Mirage.
- If escalations regularly bounce between tiers with no clear resolution, look at the Say-Do Gap.
- If leadership keeps asking what the help desk actually does all day, Invisible Value is probably the one costing the most in the next budget cycle.
Help Desk Best Practices FAQs
-
What is the difference between a help desk and a service desk?
A help desk handles reactive, ticket-based technical support, while a service desk covers the broader delivery of IT services, including requests, changes, and problems, using processes aligned to the IT Infrastructure Library (ITIL) framework. Many organizations use the two terms interchangeably, and the software that runs them often handles both jobs. Giva's article on help desk vs. service desk vs. ITSM covers the full breakdown. The distinction matters more for how a team organizes its processes than for which product it buys.
-
What is considered a good ticket reopen rate?
A ticket reopen rate under 10% is generally considered good, and under 5% is considered exceptional, according to industry benchmark data. A reopen rate that is climbing, even while it is still under those thresholds, is usually a more useful signal to act on than the raw number by itself.
-
How many tickets should one help desk agent handle per day?
There is no universal number, and chasing one is part of what causes Metric Mirage in the first place. Reasonable ticket volume per agent depends on complexity, channel mix, and how much of the work is genuinely new versus repeat issues that should already have been root-caused.
Two agents with the same ticket count can be doing very different amounts of real work if one is fielding simple password resets and the other is untangling a multi-system outage. A more useful question than how many tickets an agent closed is whether those tickets stayed closed.
-
What help desk metrics actually matter?
The metrics that matter most measure whether an issue actually got resolved, not just how fast or how often an agent moved on to the next ticket. FCR, reopen rate, and Customer Satisfaction Score (CSAT) tend to say more about real performance than tickets closed per day or AHT on their own.
-
How do I get IT leadership to recognize my team's actual workload?
Start by reporting outcomes leadership already cares about, like prevented incidents, deflected ticket volume, and resolution quality, instead of raw ticket counts. A regular report that connects help desk activity to business impact tends to get read. A dashboard of technical metrics with no business framing usually does not. Framing matters as much as the underlying numbers: "resolved 400 tickets" says far less to a budget committee than "prevented an estimated 12 hours of downtime across three departments."
Related Giva Resources
- Is Your Help Desk Properly Staffed? (staffing best practices guide)
- Types of Help Desks: Choosing the Right One for Your Business
- IT Service Desk Software Guide: Features, AI & Best Practices
- Help Desk Management: The Complete Guide for IT and Support Teams
Making Help Desk Best Practices Actually Stick
The practices covered here are not the hard part. Any team can stand up a ticketing system, publish an SLA, and build a knowledge base in a quarter. What actually separates a help desk that keeps improving from one that just checks boxes is whether anyone is watching for the four quiet failures this article named. That means someone tracing repeat tickets back to a real cause, someone questioning what the dashboard actually rewards, someone checking whether the escalation policy survives a busy day, and someone translating all of that effort into something leadership can see.
None of that requires new software. It requires someone whose job includes asking the harder question instead of the easier one when the dashboard already looks fine.
Ready to Fix What the Standard Checklist Misses?
Most help desks already have the standard practices in place. What is usually missing is visibility into whether they are actually working.
Giva's Help Desk Software is built around that visibility gap. Ticket categorization and root-cause tracking reveal repeat issues instead of letting them hide inside a resolved count, built-in reporting shows outcome metrics alongside activity numbers rather than in place of them, and automated workflows keep escalation paths consistent even when an agent is under pressure to move fast.
For teams that need SLA governance and escalation structure across a broader IT Service Management (ITSM) practice, not just a single help desk queue, ITSM Software extends the same visibility to incident, change, and problem management.
Whatever is driving your team's specific gap, the fix is rarely one more best-practice checklist. It is usually a clearer view into what is actually happening.
Get a demo to see Giva's solutions in action, or start your own free, 30-day trial today!



Categories: Help Desk